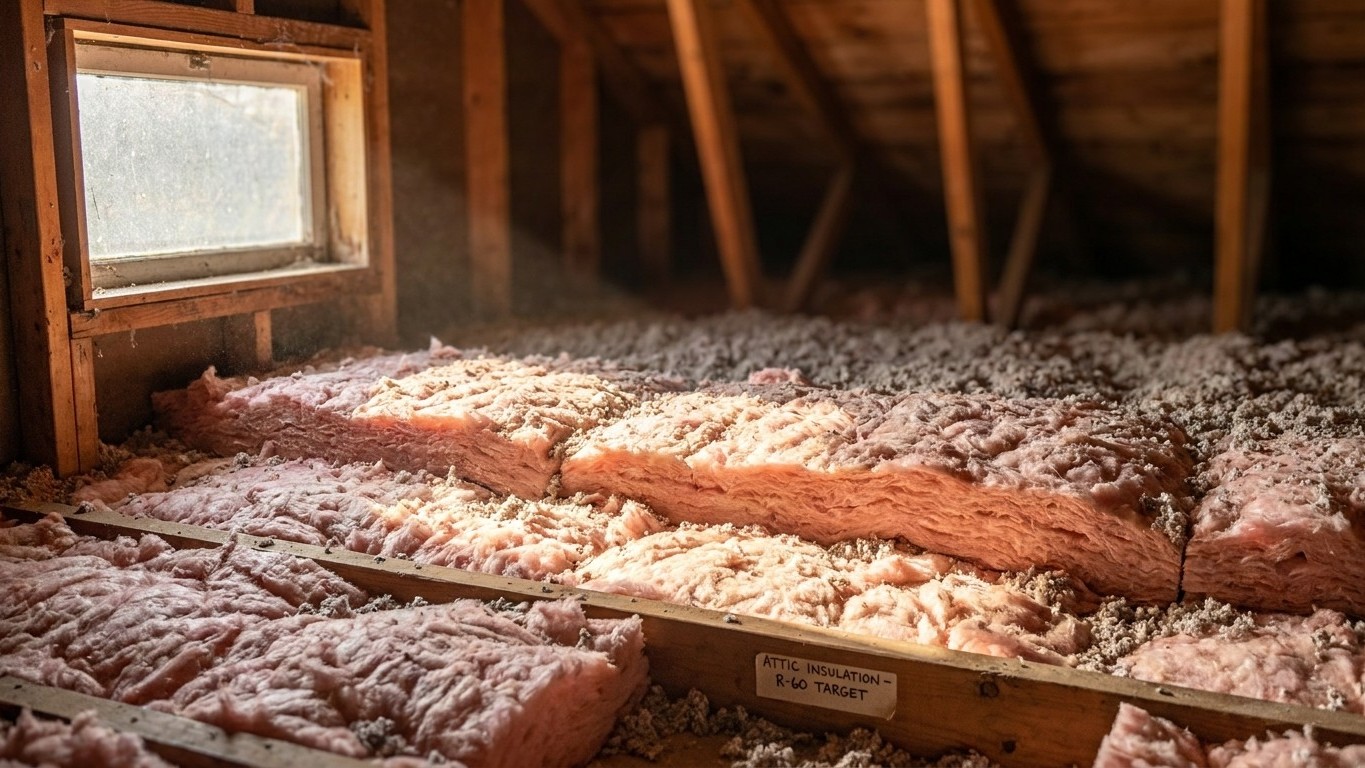

New Brunswick’s benchmark weather station, Moncton A, logs about 4,696 heating degree days a year below 18°C. That places it in Natural Resources Canada’s climate zone 6, where the recommended minimums are RSI 10.6 (R-60) in the roof or ceiling, RSI 4.8 (R-27) in the walls, RSI 4.2 (R-24) in basement walls, and RSI 7.1 (R-40) in floors over unheated spaces. These are floor-level targets, not a ceiling on what’s useful, and they describe the reference station’s zone, not automatically every municipality in the province.
Which climate zone New Brunswick is in

Natural Resources Canada doesn’t draw its climate zones on a map by province. It draws them by degree-days, a running tally of how much heating a location needs over a typical year. The thresholds are fixed: Zone 4 sits under 3,000 heating degree-days, Zone 5 runs 3,000 to 3,999, Zone 6 runs 4,000 to 4,999, Zone 7a runs 5,000 to 5,999, Zone 7b runs 6,000 to 6,999, and Zone 8 covers anything over 7,000.
| NRCan zone | Annual heating degree-days below 18°C |
|---|---|
| Zone 4 | Under 3,000 |
| Zone 5 | 3,000-3,999 |
| Zone 6 | 4,000-4,999 |
| Zone 7a | 5,000-5,999 |
| Zone 7b | 6,000-6,999 |
| Zone 8 | Over 7,000 |
Moncton A, the reference station used for this page, records roughly 4,696 heating degree-days a year, which lands it squarely in Zone 6. That’s the number this article works from. It is not, however, a claim that every corner of New Brunswick sits in Zone 6. A province this size can easily straddle a boundary, and a colder inland or northern location could log enough degree-days to sit in Zone 7a instead. There’s no single county-by-county table published for this province the way there is for some U.S. states, so the honest move is to say the figure above describes one station, and to point out that a reader elsewhere in New Brunswick should check their own municipality’s degree-days before assuming Zone 6 applies to them too.
Unlike the American IECC system, where a letter after the zone number (A for moist, B for dry, C for marine) changes which row of a table applies, NRCan’s zones don’t carry a moisture letter for most of the range. The only split is at the top: Zone 7 breaks into 7a and 7b depending on where a location falls within that 5,000-to-6,999 band. That’s a different system from the one used on U.S. pages of this site, counted against a different base Temperature and a different degree-day period, and the two should never be read side by side as if they measured the same thing.
The insulation levels that apply here
For a home sitting in Zone 6, which is where the Moncton A reference station lands, Natural Resources Canada’s recommended minimum insulation values look like this.
| Component | RSI (nominal) | R-value (nominal) |
|---|---|---|
| Roof or ceiling | 10.6 | 60 |
| Walls | 4.8 | 27 |
| Basement walls | 4.2 | 24 |
| Floor over unheated space | 7.1 | 40 |
Those four rows aren’t interchangeable, and none of them is a stand-in for another. The roof or ceiling figure is the highest of the group because heat rises and an unconditioned attic is usually the single largest area of exposed surface in a house. The floor-over-unheated-space figure matters for anyone with a crawlspace or an unheated area below living space, and it’s a separate target from the basement wall number, which covers a different assembly entirely.
Why these are minimums, not a code number
NRCan describes these as recommended minimum insulation values, and that phrasing matters. The building code that actually governs new construction and major renovation in New Brunswick is set provincially and enforced municipally, and it can ask for more than this table shows. Treat the RSI and R figures above as a floor a homeowner should not fall below, not as a substitute for checking the code that applies to a specific project.
It’s also worth restating what this table is not. It is not a set of three attic numbers with a floor figure tucked in somewhere unlabeled. Each row here covers one distinct part of the building envelope, and none of the values should be converted into a thickness in inches, since that depends on which material is being installed. The number that matters is the one printed on the product’s packaging, checked against the RSI or R-value in this table.
Sealing comes before insulating
Insulation slows heat moving through a material. It does nothing to stop air moving around it. That distinction is why U.S. ENERGY STAR treats air sealing and insulation as two steps of a single project rather than one job, and why its own project guidance puts attic air sealing before attic insulation. Lay new insulation over a gap around a wiring penetration or a plumbing stack, and the gap doesn’t close. It just gets harder to find.
The practical order of work follows from that logic:
- Seal air leaks in the attic first, before any new insulation goes in
- Add or top up attic insulation once the sealing is done
- Seal and insulate the rim joist area
- Address the floor over a crawlspace or unheated area
- Move to wall assemblies last
That sequence isn’t arbitrary. Attics are usually the most accessible part of a house and the place where the largest air leaks tend to collect, so working there first gets the biggest return for the effort. Walls come last partly because they’re the hardest and most disruptive part of the envelope to open up, and partly because the attic and rim joist work typically closes off more of the total leakage path per hour of labor. For the specifics of how each of those steps gets done, including recommended techniques and materials, the national insulation guides on this site cover the detail that doesn’t belong in a page about regional R-values.
What the winter here actually asks for
Degree-days measure demand, not temperature. At roughly 4,696 heating degree-days a year, Moncton A’s climate asks a furnace or heat pump to work through a long, sustained heating season rather than a handful of sharp cold snaps. That number is the reason Zone 6’s insulation minimums sit as high as they do.
What New Brunswick homes actually heat with changes how that demand should be met. Statistics Canada’s 2023 survey of primary heating systems shows electric baseboard heaters as the most common system at 31%, heat pumps next at 27%, and forced-air furnaces well behind at 9%. Boilers with hot-water or steam radiators and heating stoves both come back as not reported, which means the estimate was suppressed as statistically unreliable, not that nobody in the province uses them.
That mix matters for where insulation dollars do the most good. A province where forced-air furnaces are a minority system, and electric baseboard and heat pumps dominate, has less ductwork running through unconditioned attics than a furnace-heavy region does. But that 9% forced-air share is not nothing, and any home on ducted heat with trunk lines running through an unheated attic space is losing energy through the ducts themselves, a loss that ceiling insulation alone does not fix.
Given the heating mix and the degree-day load, the order of priorities for a New Brunswick home looks like this:
- Seal and insulate the attic first, since it carries the highest recommended R-value in this zone and is usually the biggest accessible loss
- Check any forced-air ductwork running through the attic or another unconditioned space, since insulation on the surrounding structure doesn’t seal duct leaks
- Address basement rim joists and floors over unheated spaces, both called out at R-40 and R-24 in the table above
- Move to walls once the attic, ducts, and floor work are done
For homes with ducted forced-air systems, the duct sealing and insulation guides on this site cover that second step in more detail than fits here.
What the work is worth
U.S. ENERGY STAR’s own estimate, drawn from energy modeling, puts it this way: “EPA estimates that homeowners can save an average of 15% on heating and cooling costs (or an average of 11% on total energy costs) by air sealing their homes and adding insulation in attics, floors over crawl spaces, and accessible basement rim joists.” Both percentages matter, and so does what each one is measured against. The 15% figure is a share of heating and cooling costs specifically; the 11% figure is a share of total energy costs, a broader number that includes things like lighting and appliances alongside heating.
These are averages from modeling of a typical existing home, not a guarantee attached to any single house in New Brunswick or anywhere else. The modeling also names exactly where the work happened: attics, floors over crawl spaces, and accessible basement rim joists. It says nothing about walls, windows, or doors, and stretching the figure to cover those areas would misstate what was actually measured.
It’s worth keeping this number separate from two others that sound similar but measure different things. ENERGY STAR’s own program landing page cites “up to a 10% savings on your annual energy bills” for the same kind of work, an “up to” figure against a different baseline. The U.S. Department of Energy’s 10% figure, meanwhile, describes the effect of a thermostat setback of 7 to 10 degrees Fahrenheit held for eight hours a day, and has nothing to do with insulation at all. Three real numbers, three different claims, and only the first one belongs to the question this page set out to answer.