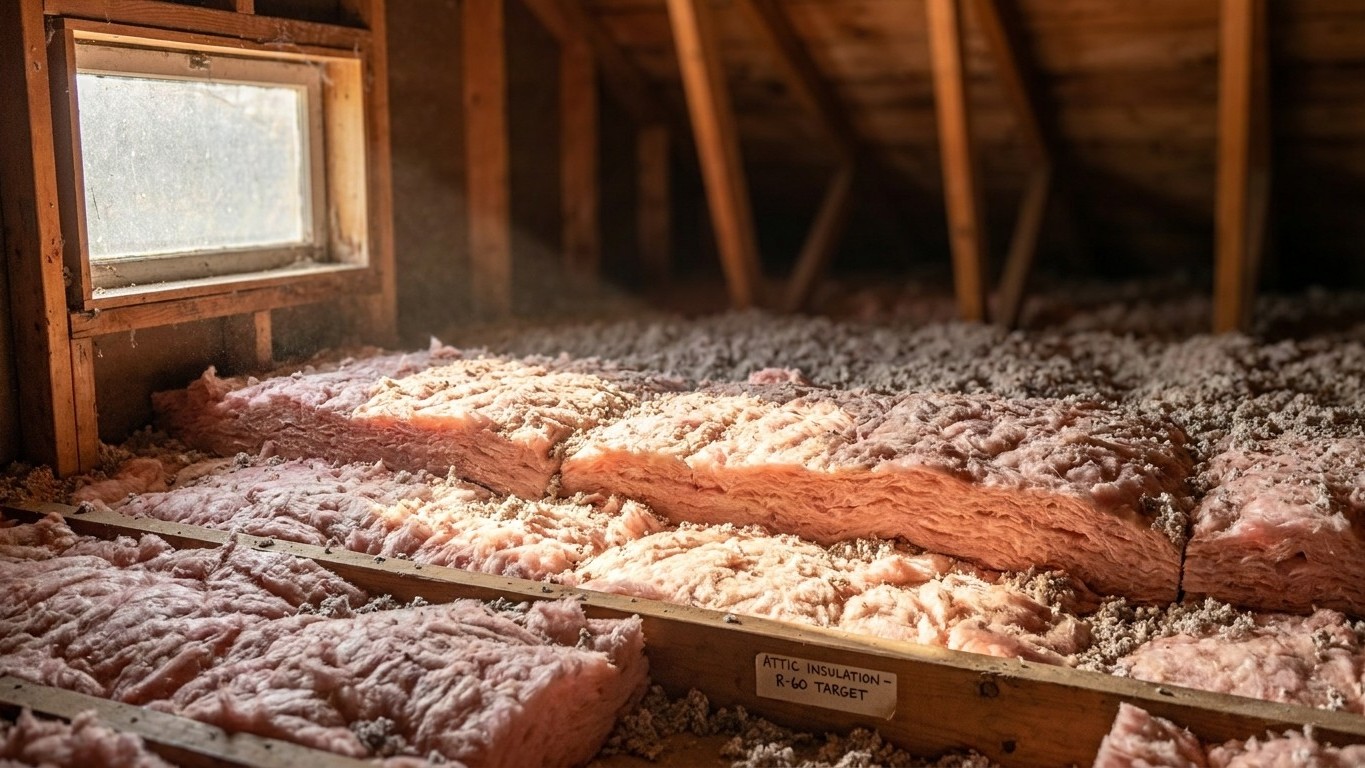

Washington spans four IECC climate zones across its 39 counties, so there’s no single R-value that fits every home in the state. The right amount of insulation depends on which zone a county sits in, and the levels range from R49 to R60 in the attic, with floor requirements shifting too. Here’s how the zones break down and which numbers actually apply.
Which climate zone Washington is in

There is no single climate zone for Washington. The state’s 39 counties split across four IECC zones: zone 5B covers 18 counties, zone 4C covers 14 counties, zone 5C covers 4 counties, and zone 6B covers 3 counties, according to the 2021 International Energy Conservation Code (IECC) Table R301.1. That’s a genuine spread, not a rounding error, and it means a page that hands out one R-value for “Washington” is wrong for a chunk of its readers no matter which number it picks.
A count of counties isn’t a count of people, either. Eighteen counties in zone 5B sounds like the majority, but that phrase alone doesn’t tell you where the population actually lives. The honest way to read this table is county by county, not as a percentage of the map.
| Climate Zone | Number of Counties |
|---|---|
| 5B | 18 |
| 4C | 14 |
| 5C | 4 |
| 6B | 3 |
A climate zone is a construction-code category that groups counties by how demanding their heating and cooling seasons are, using the number as a rough severity scale (lower numbers mean milder winters, higher numbers mean colder ones) and a letter for moisture. A means moist, B means dry, and C means marine, the coastal pattern of wet, mild winters and cool, dry summers found along the Pacific Northwest. Zones 7 and 8 don’t carry a letter at all, though that’s not relevant to Washington since none of its counties fall in those zones.
That letter matters more than it looks. The ENERGY STAR insulation table groups zones 4A and 4B into one row but treats 4C on its own, folded in with zones 5 and 6. Get the letter wrong and you can end up reading the wrong row of the very table this page is about to lay out. If you don’t already know which zone your own county falls in, the county-by-county table above is the place to check it, or the ENERGY STAR climate zone map, rather than guessing from a regional label like “western Washington” or “the coast.”
The insulation levels that apply here
ENERGY STAR publishes recommended insulation levels for retrofitting existing wood-framed buildings, based on the 2021 IECC Residential Provisions. The table has a header that gets misread constantly: “Add Insulation to Attic” spans two separate columns, one for an attic that’s currently uninsulated and one for an attic that already has 3 to 4 inches in place, and then a third column entirely for the floor. Three numbers per zone, but they are not three attic figures.
| Zone | Attic (uninsulated) | Attic (has 3-4 in.) | Floor |
|---|---|---|---|
| Zone 1 | R30 | R25 | R13 |
| Zone 2 | R49 | R38 | R13 |
| Zone 3 | R49 | R38 | R19 |
| Zones 4A and 4B | R60 | R49 | R19 |
| Zones 6, 5, and 4C | R60 | R49 | R30 |
| Zones 7 and 8 | R60 | R49 | R38 |
Now line this up against the county breakdown above. Washington’s four zones are 5B, 4C, 5C, and 6B. Every one of them lands in the same row: “Zones 6, 5, and 4C.” That’s an actual feature of how ENERGY STAR grouped its table, not an average calculated to make this page simpler. A home in a 6B county in the mountains and a home in a 4C county along Puget Sound are reading the identical row: R60 for an uninsulated attic, R49 if there’s already 3 to 4 inches up there, and R30 for the floor.
That’s a rare piece of good news for a state that spans four zones. It doesn’t mean every home in Washington needs the same amount of insulation regardless of anything else, only that when it comes to selecting the right row of this particular retrofit table, the state’s zone spread doesn’t create four different answers the way it might elsewhere. Don’t convert any of these R-values into a number of inches. Depth depends entirely on the material, fiberglass batts, blown cellulose, and spray foam all pack R-value differently per inch, and the correct depth for a given product is printed on its packaging, not derived from this table.
Sealing comes before insulating
ENERGY STAR treats air sealing and insulation as two steps of a single project, and its own project guidance puts attic air sealing before attic insulation, not after. The reasoning is straightforward: insulation slows heat moving through a material, but it does nothing to stop air moving around it. Lay batts or blown fill over an unsealed gap around a chimney chase, a bath fan duct, or a top-plate penetration, and you’ve hidden the leak, not closed it. The air keeps moving, carrying conditioned air out and outside air in, right under a blanket that looks complete from above.
The recommended order of work reflects that logic:
- Seal air leaks in the attic first, at penetrations, chases, and the attic hatch itself
- Add attic insulation to the levels in the table above
- Seal and insulate the rim joist
- Address the floor over a crawl space or the crawl space itself
- Move to walls last
Notice that walls come at the end, not the start. Attics and floors are where ENERGY STAR’s own modeling concentrates, and they’re also the easiest places to both seal and insulate in an existing home without opening up finished wall cavities. The published savings estimate for this kind of project (more on that below) covers sealing and insulating together as one combined effort, not sealing by itself, so there’s no separate number to attach to skipping straight to caulk and foam without following through on the insulation step. For the specifics of each stage, air sealing techniques, attic insulation installation, rim joist detailing, crawl space treatment, this site’s national insulation guides walk through the mechanics in more depth than a single state page can.
What the winter here actually asks for
Heating degree days measure demand, not temperature. The figure adds up, for every day of the year, how far the average temperature fell below 65°F, and it’s the number that turns a climate into a heating bill. At Seattle-Tacoma International Airport, NOAA’s 1991-2020 climate normals put that figure at about 4,376 heating degree days a year, against roughly 265 cooling degree days. That’s a heating season that runs long, even if it rarely gets brutally cold, and a cooling season that barely registers by comparison. Twice the degree days means roughly twice the fuel for an identical house, so this number is the honest way to compare Washington’s heating burden with another state’s, not a temperature reading on its own.
What do homes here actually heat with? The U.S. Energy Information Administration’s 2020 Residential Energy Consumption Survey state tables show 47% of Washington homes rely on a furnace as their main heating equipment, and 9% run a central heat pump. Steam or hot-water boiler use wasn’t reported in usable numbers, an estimate suppressed for reliability, which is not the same thing as saying nobody in the state uses one. By fuel, electricity leads at 55%, ahead of natural gas at 37%, with fuel oil, kerosene, and propane all falling into that same suppressed-estimate category.
Put those two facts together and a pattern emerges. A state running mostly on furnaces pushing air through ductwork has a different weak point than one built around boilers and radiators, because ductwork routed through an unconditioned attic loses conditioned air before it ever reaches a room, no matter how thick the ceiling insulation above it is. For Washington’s furnace-heavy, duct-based housing stock, that makes duct sealing and insulation a genuine local priority sitting right alongside the attic work above:
- Seal and insulate attic ductwork, since almost half the state’s homes push heated air through it
- Follow the sealing-then-insulating order in the attic itself
- Address rim joists and floors over crawl spaces, common in the region’s older wood-framed housing
- Consider heat pump performance where electricity is already the dominant heating fuel
This site’s duct sealing and insulation guides go into the specifics of finding and closing duct leaks, which matters more here than in a state where boilers and radiators do the heating instead.
What the work is worth
ENERGY STAR’s own modeling puts a number on the combined project. In its own words: “EPA estimates that homeowners can save an average of 15% on heating and cooling costs (or an average of 11% on total energy costs) by air sealing their homes and adding insulation in attics, floors over crawl spaces, and accessible basement rim joists.” Both figures matter together, 15% of the heating and cooling portion of a bill, 11% of the entire energy bill, and neither one stands alone as “the” savings number.
These are averages drawn from energy modeling of a typical existing U.S. home, not a guarantee for any specific house in Boise, Bellingham, or Spokane. The modeling also names exactly where the work happens: attics, floors over crawl spaces, and accessible basement rim joists. It doesn’t extend to walls, windows, or doors, so a project that stops at those three areas is the one this percentage actually describes.
It’s worth keeping this figure separate from two others that sound similar but aren’t the same claim. ENERGY STAR’s own program landing page mentions “up to a 10% savings on your annual energy bills” for the same category of work, phrased as a ceiling rather than an average. The Department of Energy’s often-cited 10% figure is about something else entirely, a thermostat setback of 7 to 10 degrees held for eight hours a day, and has nothing to do with insulation or air sealing at all. Three real numbers, three different claims, and mixing them up is how an accurate figure turns into a misleading one.