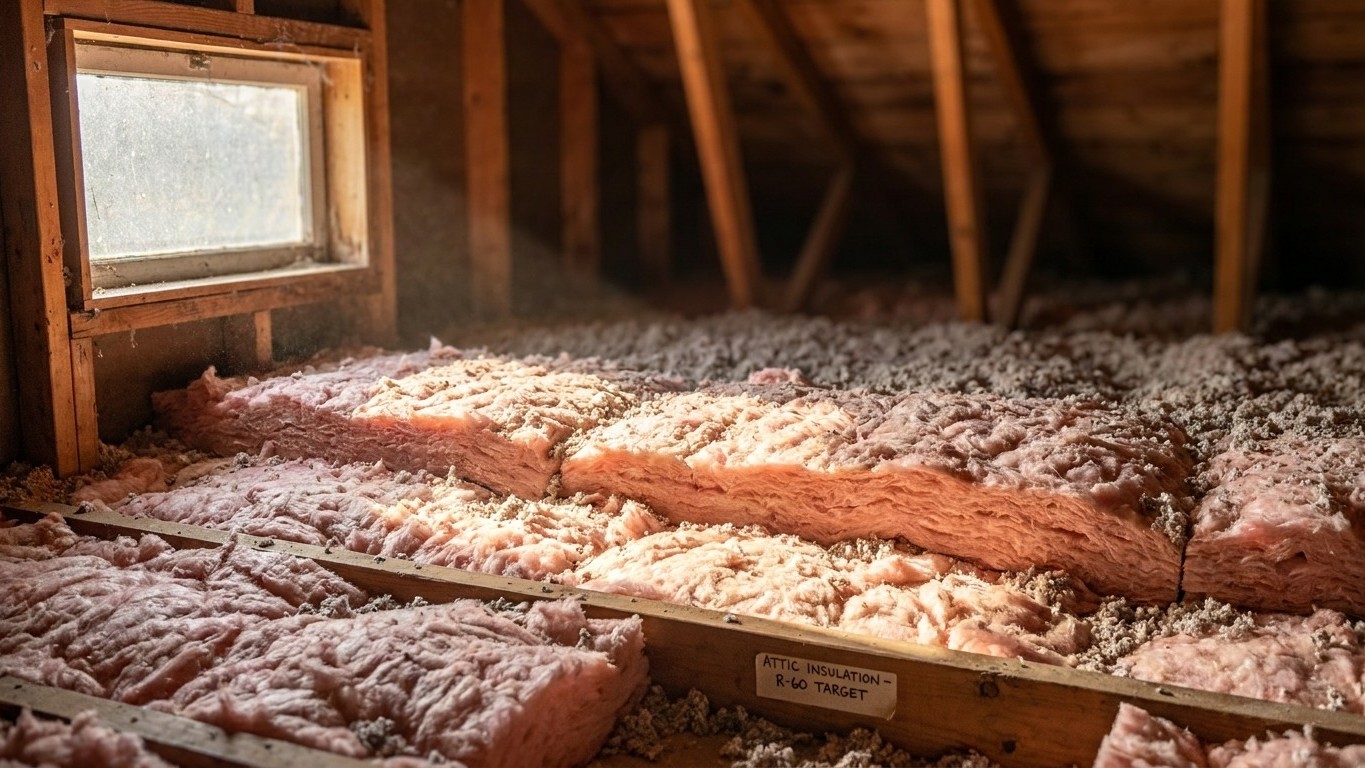

Indiana doesn’t have one Insulation answer. The state splits across two federal climate zones, and the ENERGY STAR-recommended R-values shift depending on which zone a county falls into. Attics generally call for R49 or R60, and floors for R19 or R30, but the exact pair depends on the county, not a statewide average.
Which climate zone Indiana is in

Indiana is split across two IECC climate zones. Of the state’s 92 counties, 47 sit in zone 5A and 45 sit in zone 4A, according to the 2021 International Energy Conservation Code’s county-by-county climate zone table. That’s close to an even split by county count, and it means there is no single “Indiana zone” to quote. A page, or a contractor, that gives one figure for the whole state is describing only half of it.
It’s worth being precise about what that split is, and isn’t. Forty-seven counties in zone 5A and forty-five in zone 4A is a count of counties, not a count of people. A handful of populous counties can carry a disproportionate share of the state’s households, so a county tally tells you where the zone lines fall on a map, not how many homes sit on each side of them. If your goal is to know which row of the Insulation table applies to your own house, the county is what matters, not a statewide percentage.
What a climate zone number and letter actually mean
The number in an IECC climate zone (4, 5, 6, and so on) is a rough measure of how cold and long the heating season runs, with higher numbers meaning colder. The letter that follows it, A, B, or C, is a moisture regime: A for moist, B for dry, C for marine. Zones 7 and 8, reserved for the coldest parts of the country, don’t carry a letter at all. That letter isn’t decorative. The ENERGY STAR insulation table groups zones by both the number and the letter, so 4A and 4B share one recommended level while 4C gets grouped with zones 5 and 6 instead. Get the letter wrong and you can end up reading the wrong row entirely.
None of this tells an individual reader which zone their own house sits in, and this page won’t try to guess. The right move is to check your county against the IECC’s official table, or against the map ENERGY STAR publishes for the same purpose, before you buy any material. Everything past this point assumes you know which side of Indiana’s split you’re on.
The insulation levels that apply here
ENERGY STAR publishes a retrofit table for existing wood-framed houses, built from the 2021 IECC’s residential provisions. It’s organized by climate zone, and the header is worth reading carefully before you shop for material, because it’s merged in a way that trips people up. Two of the three numbers per zone cover the attic, one for a house that’s currently uninsulated and one for a house that already has 3 to 4 inches up there. The third number is a completely different assembly: the floor. Here’s the table in full.
| Zone | Attic if uninsulated | Attic if already has 3-4 in. | Floor |
|---|---|---|---|
| Zone 1 | R30 | R25 | R13 |
| Zone 2 | R49 | R38 | R13 |
| Zone 3 | R49 | R38 | R19 |
| Zones 4A and 4B | R60 | R49 | R19 |
| Zones 6, 5 and 4C | R60 | R49 | R30 |
| Zones 7 and 8 | R60 | R49 | R38 |
For Indiana, two rows are relevant, and only two. The 45 counties in zone 4A fall under “Zones 4A and 4B”: R60 for an uninsulated attic, R49 for one that already has 3 to 4 inches, and R19 for the floor. The 47 counties in zone 5A fall under “Zones 6, 5 and 4C”: the same attic numbers, R60 and R49, but R30 for the floor instead of R19. That’s the practical difference between the two halves of the state on this table: the attic target doesn’t change, but the floor does, and it changes by 11 R-value points. A house in the northern half of the state built over a crawl space or unheated basement needs meaningfully more floor insulation than one built the same way in the southern counties, even though both would be told to insulate their attic to the same level.
These figures are retrofit targets for existing wood-framed buildings, not new-construction code minimums, and they’re not a suggestion to convert into a thickness at the store. R-value per inch varies by material, fiberglass batts, blown cellulose, and rigid foam all pack different R-values into the same depth, and the actual coverage per inch is printed on the product’s own packaging, not on this table.
Sealing comes before insulating
ENERGY STAR treats air sealing and insulation as two parts of a single project, and its own project guidance puts attic air sealing before attic insulation, not after. That order isn’t arbitrary. Insulation slows heat moving through a material; it does nothing to stop air moving around it. A batt or a layer of blown-in fill laid over an unsealed can light, a plumbing stack, or a gap around a chimney chase doesn’t close that gap. It just buries it, which makes the leak harder to find on the next inspection.
The practical sequence ENERGY STAR lays out runs in a specific order, and skipping ahead in it wastes the later steps:
- Seal air leaks in the attic first, at penetrations, top plates, and the attic hatch
- Add attic insulation to the target R-value for the applicable zone
- Seal and insulate the rim joist
- Address the floor over a crawl space or unconditioned basement
- Only then move to wall insulation, where accessible
Note that no savings figure attaches to sealing by itself in the published guidance. The estimate ENERGY STAR puts out covers sealing and insulation together, as one project, and pulling a number out to apply to sealing alone isn’t something the source supports. For the mechanics of each step, the attic-sealing checklist, rim joist detailing, and crawl space treatment, the national insulation guides on this site cover the how-to; this page is about which numbers apply in Indiana specifically.
What the winter here actually asks for
Indianapolis averages about 5,250 heating degree days a year against a base of 65°F, alongside roughly 1,139 cooling degree days, according to NOAA’s 1991-2020 climate normals. Degree days aren’t a temperature reading; they’re a running tally of how far below 65°F the average daily temperature sits, added up across the whole year. A bigger number means more total heating demand, and 5,250 heating degree days against only 1,139 cooling degree days tells you plainly which season drives the energy bill in this state. Winter, by a wide margin, is where the money goes.
What Indiana homes actually burn to meet that demand is worth knowing before choosing where to spend on insulation. According to the U.S. Energy Information Administration’s 2020 Residential Energy Consumption Survey, 82% of Indiana households heat with a furnace, 7% with a central heat pump, and 3% with a steam or hot-water boiler. By fuel, 65% run on natural gas and 26% on electricity, with 7% on propane; the fuel oil and kerosene figure wasn’t reported in the survey, which means the estimate was too small or unreliable to publish, not that it was zero.
A furnace-dominant state built around ducted air changes the priority list, because ductwork routed through an unconditioned attic is its own heat-loss pathway that ceiling insulation alone doesn’t fix. Sealing the attic floor around duct boots and chases matters as much as the insulation level sitting on top of it. In rough order, the priorities for a typical Indiana furnace-and-duct house look like this:
- Seal duct boots and chases where they penetrate the attic floor
- Bring attic insulation up to the zone-appropriate level from the table above
- Check duct insulation itself where runs pass through unconditioned space
- Address the floor over any crawl space or unheated basement
For the specifics of sealing and insulating ductwork in an unconditioned attic, the duct guides on this site cover that work in more detail than fits here.
What the work is worth
ENERGY STAR’s own methodology page states it plainly: “EPA estimates that homeowners can save an average of 15% on heating and cooling costs (or an average of 11% on total energy costs) by air sealing their homes and adding insulation in attics, floors over crawl spaces, and accessible basement rim joists.” Both numbers matter together, not separately. Fifteen percent applies specifically to heating and cooling costs; eleven percent applies to the household’s total energy bill, a smaller share because it includes things insulation doesn’t touch, like water heating and appliances.
These are averages pulled from energy modeling of a typical existing U.S. home, not a guarantee for any single house in Terre Haute or South Bend. The estimate also names exactly where that modeled work happened: attics, floors over crawl spaces, and accessible basement rim joists. It doesn’t extend to walls, windows, or doors, and stretching the figure to cover those upgrades isn’t something the source backs.
It’s also worth keeping this number separate from two others floating around the same topic. ENERGY STAR’s general program landing page cites “up to a 10% savings on your annual energy bills” for the same category of work, a different, looser figure on a different base. The Department of Energy’s often-quoted 10% figure is unrelated to insulation entirely; it refers to savings from a thermostat setback of 7 to 10 degrees held for eight hours a day. Three real numbers, three different claims, and conflating them is how an accurate figure turns into a misleading one.