
Yes, insulation keeps a home in Indiana cooler, though the payoff leans more toward winter than summer for most of the state. With roughly 15 days a year crossing 90°F, Indiana’s heat load is real but short, and the same insulation that blocks that heat also holds in the winter warmth that dominates the calendar here.
The short answer for Indiana

At the Indianapolis reference station, NOAA’s 1991-2020 climate normals put the average at 14.6 days a year reaching 90°F or higher. That’s the measure of summer heat load, not a description of typical July weather, and it puts Indiana on the modest end of the national scale. Compare that to states along the Gulf Coast where triple digits arrive by Memorial Day and stack up for months, and the picture is clear: Indiana’s summer heat is a real but compressed event, not a season-long siege.
That timing matters because Indiana straddles two IECC climate zones. Of its 92 counties, 47 sit in zone 5A and 45 in zone 4A, a near-even split that puts the state squarely in the country’s heating-dominated territory rather than its cooling-dominated one. Both zones are classified with the letter A, meaning a moist moisture regime, but the number is what counts for insulation planning: zones 4 and 5 are cold-and-mixed climates where the furnace runs more months than the air conditioner does.
So the honest answer for a homeowner here isn’t the same one you’d give in Phoenix or Baton Rouge. Insulation still cools the house during those 14.6 days and the weeks around them when temperatures climb into the 80s. Attics bake, ducts overheat, and upstairs bedrooms turn into ovens by late afternoon, regardless of how short the season is. But the bulk of the return on an insulation project in Indiana comes from the long heating season that follows, not from the brief stretch of summer heat. That’s not a reason to skip the work. It’s a reason to size expectations correctly: this is a state where insulation earns its keep year-round, with winter carrying the larger share of the savings.
What happens above the ceiling
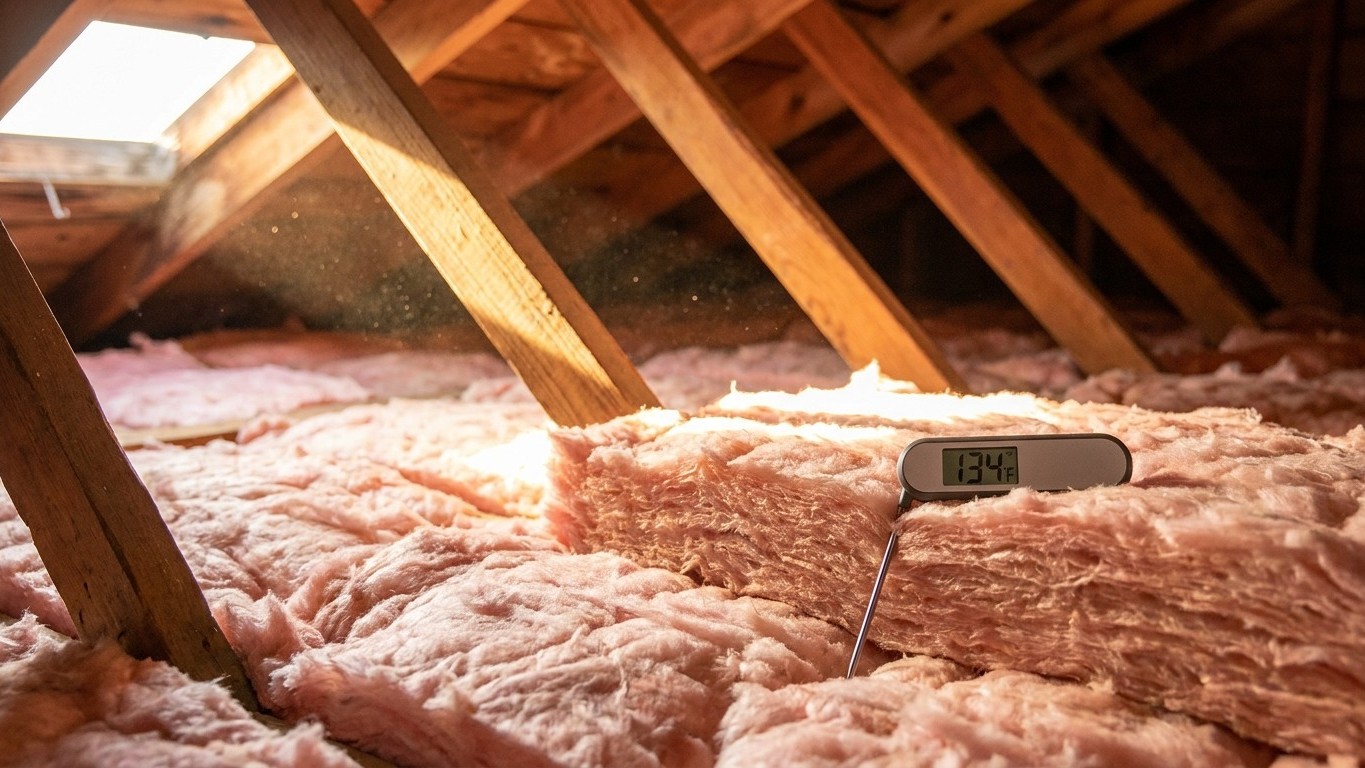
A roof deck under direct summer sun can push attic air far past the outdoor temperature, sometimes 40 or 50 degrees hotter than the yard below. Everything under that roof deck, the ceiling drywall, any ductwork running through the space, boxes stored near the rafters, sits inside that superheated air pocket. Heat doesn’t wait for a wall to conduct through; it radiates down from the roof deck and convects through any gap in the ceiling plane, and in a house with a thin layer of attic insulation, that heat load reaches the living space directly below.
The insulation itself doesn’t know which season it’s in. It resists heat flow in whichever direction that flow is moving, which means the same batts or blown fill that hold furnace heat inside in January are working just as hard in July, except the flow has reversed and gravity is now pulling hot attic air down into the house instead of letting warm room air escape upward. That’s the point worth sitting with: attic insulation isn’t a winter product that happens to help in summer. It’s a single improvement that pays in both directions, which makes it one of the few home upgrades where there’s no seasonal trade-off to weigh.
What ENERGY STAR recommends for this state’s zones
ENERGY STAR publishes retrofit recommendations for existing wood-framed homes by climate zone, and because Indiana spans two zones, two rows of that table apply depending on county:
- Zones 4A and 4B: attic if uninsulated, R60; attic if you already have 3-4 inches, R49; floor, R19.
- Zones 6, 5, and 4C: attic if uninsulated, R60; attic if you already have 3-4 inches, R49; floor, R30.
The two rows agree on attic targets and diverge on the floor value, which is the one that matters most for a house over a crawl space or vented basement. These figures are retrofit guidance for existing construction, not new-build code minimums, and ENERGY STAR doesn’t publish a zone map at the state or county level here. A homeowner who wants to confirm which row applies to a specific address should check the ENERGY STAR zone map directly rather than guess from a county name.
What homes in Indiana cool with
The Energy Information Administration’s 2020 Residential Energy Consumption Survey shows 94% of surveyed households in the state use some form of air-conditioning equipment, and 81% use a central air-conditioning unit specifically. The gap between those two figures, 13 percentage points, represents households cooling with something other than central air: a ductless mini-split, a window unit, a wall unit, or a portable unit. That share, reported at 20% of homes using an individual air-conditioning unit, tells you a real slice of Indiana’s housing stock isn’t relying on ducted central air at all. Ceiling fans, meanwhile, show up in 78% of homes, doing the quieter job of moving air rather than cooling it outright.
These figures describe households surveyed, not every house standing in the state, and any category too small to publish reliably shows up as suppressed in EIA’s tables rather than as zero. Still, the split matters for how insulation actually connects to comfort. In the 81% of homes running central air through attic ductwork, those ducts sit inside the same superheated attic described above, which means ceiling insulation does nothing to protect the ducts themselves. That’s a separate problem, handled by duct sealing and duct insulation rather than by attic fill, and it’s worth checking a dedicated duct insulation guide if that’s the setup in question.
For the smaller share running window units, wall units, or mini-splits, the calculation is simpler: there’s no attic run to worry about, and the insulation and air-sealing of the room itself, walls, windows, the gap around the unit, is what determines how hard that single unit has to work. A room air conditioner guide covers that scenario in more detail. Either way, insulation and cooling equipment are solving different halves of the same problem, and assuming one covers the other is a common and costly mistake.
What the heat asks for that the cold does not
Two measures belong specifically to hot climates and don’t translate to cold ones, and Indiana’s moderate summer means neither is an automatic yes here.
A radiant barrier is a reflective material installed in the attic to bounce radiant heat back toward the roof deck instead of letting it soak into the space below. It carries no R-value and isn’t insulation in the conventional sense; it’s a different physical mechanism entirely, and it earns its keep only where a roof deck is absorbing intense, sustained solar radiation. In a state averaging 14.6 days above 90°F, that scenario shows up for a few weeks a year rather than for months on end. A radiant barrier isn’t wrong for an Indiana attic with heavy sun exposure and existing ductwork up there, but it’s a secondary upgrade behind getting attic insulation to the recommended R-values first, not the priority move it would be in a Sun Belt state.
Vapor behavior flips with the seasons too. In a warm, humid climate, moisture in summer pushes from the humid outdoor air toward the cooler, drier indoor air, which is the reverse of how vapor moves in winter heating climates. That’s why the model energy code doesn’t require an interior vapor retarder in the country’s warmest, most humid zones. Both of Indiana’s zones carry the “A” moisture designation, meaning moist rather than dry or marine, but where a vapor barrier belongs in a wall or ceiling assembly here depends on the specific zone and assembly type. That’s a question worth settling on a dedicated vapor barrier page for this state rather than deciding it from a general summer heat article.
What the work is worth
ENERGY STAR’s own estimate is the one to use here, and it’s worth quoting exactly rather than rounding it into something looser: “EPA estimates that homeowners can save an average of 15% on heating and cooling costs (or an average of 11% on total energy costs) by air sealing their homes and adding insulation in attics, floors over crawl spaces, and accessible basement rim joists.”
Both numbers matter, and neither works without its denominator. The 15% applies specifically to combined heating and cooling costs, not to the electric bill as a whole. The 11% applies to total energy costs, the broader number that includes everything else running through the meter. That’s the figure that answers the question behind this whole page: the saving isn’t a winter number that happens to carry over into summer. It’s a combined heating-and-cooling estimate from the start, built for a climate exactly like Indiana’s where both seasons do real work on the energy bill.
Two limits are worth keeping in mind. First, this is an average drawn from energy modeling of a typical existing U.S. home, not a guarantee for any specific house, and results shift with a home’s age, current insulation levels, and how tight the ductwork already is. Second, the estimate covers a specific set of locations: attics, floors over crawl spaces, and accessible basement rim joists. It doesn’t extend to walls, windows, or doors, and stretching it further than that misrepresents what was actually modeled. For a state split between two heating-dominated climate zones, with a short but real summer heat spike layered on top, that’s a reasonable and well-documented place to start.