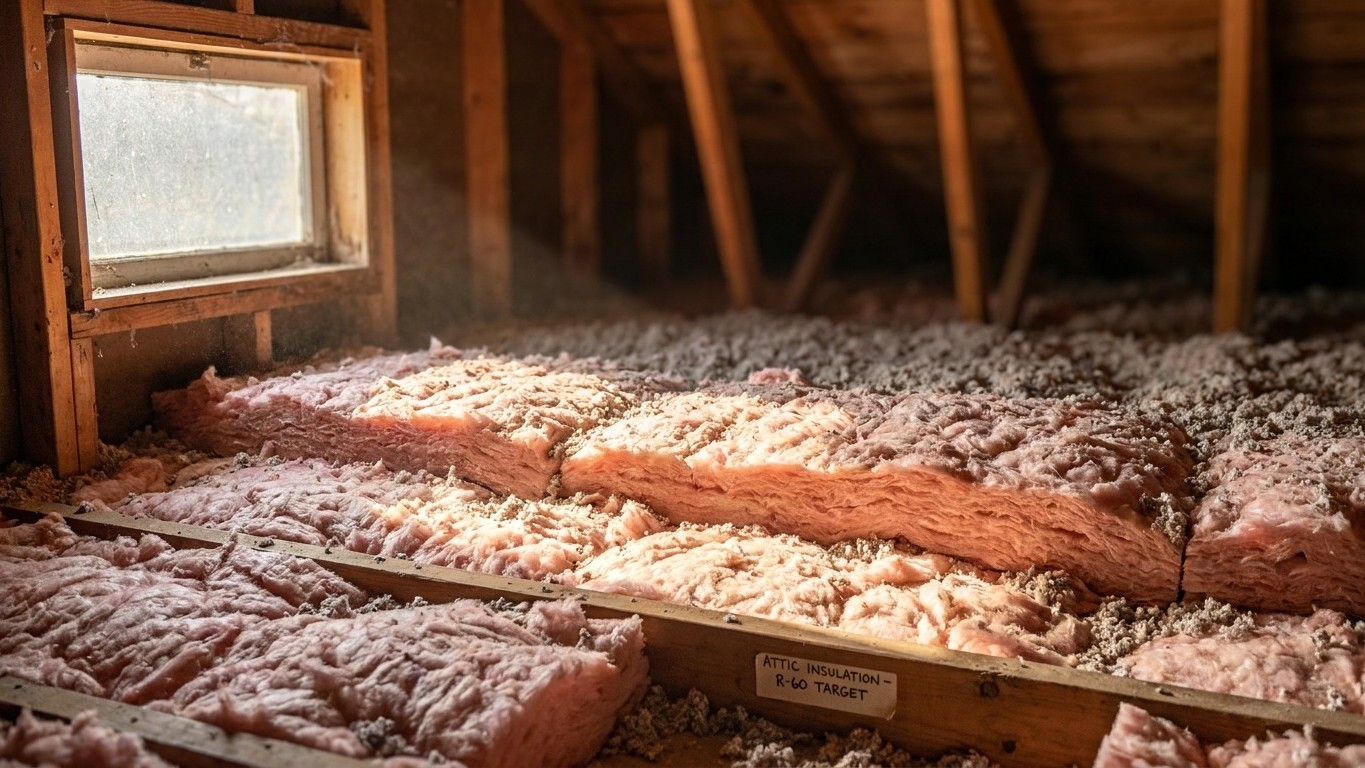

There isn’t one number for the whole province. Natural Resources Canada rates the reference station at St. John’s A in climate zone 6, which calls for RSI 10.6 (R 60) in the roof or ceiling, RSI 7.1 (R 40) under floors over unheated space, RSI 4.8 (R 27) in walls, and RSI 4.2 (R 24) in basement walls. Labrador and the island’s interior run colder, so treat those figures as a floor, not a province-wide answer.
Which climate zone Newfoundland and Labrador is in

Natural Resources Canada doesn’t sort the country into zones by province or by county line. It sorts by heating demand, counted in heating degree-days below 18 degrees Celsius, and adds up how far below that threshold the average Temperature falls, day by day, over a full year. More degree-days means more fuel burned to hold a house at a comfortable temperature, and the zone number simply reflects that math. This is a different system than the one used south of the border: American pages on this site talk about IECC zones counted against 65 degrees Fahrenheit, with letters attached (A for moist, B for dry, C for marine). NRCan’s zones carry no such letters for most of the country, the number alone sets which row of the Insulation table applies.
The zone bands run like this, straight from Natural Resources Canada’s own table:
| Zone | Annual heating degree-days (below 18°C) |
|---|---|
| 4 | Under 3,000 |
| 5 | 3,000 – 3,999 |
| 6 | 4,000 – 4,999 |
| 7a | 5,000 – 5,999 |
| 7b | 6,000 – 6,999 |
| 8 | Over 7,000 |
At St. John’s A, the Environment and Climate Change Canada reference station for the capital, the 1981-2010 normal comes to roughly 4,755 heating degree-days a year. That drops the Avalon Peninsula’s largest city squarely into zone 6. But St. John’s is a coastal city warmed somewhat by the Atlantic, sitting at the mild end of a province that stretches deep into Labrador and across a large, cold interior. There is no single figure published here for the whole territory, and no county-by-county table the way American states get one under the 2021 IECC. A reader in central Labrador is very likely sitting in a colder band, possibly zone 7 or 8, simply because the degree-day count runs so much higher there than on the Avalon.
The honest move, before buying any insulation, is to check the heating degree-days for your own municipality or the nearest Environment and Climate Change Canada station, rather than assume the St. John’s number applies. A house in Labrador City is not fighting the same winter as a house in downtown St. John’s, even though both sit in the same province and the same time zone.
The insulation levels that apply here
Natural Resources Canada’s Table 2-1, from its “Keeping the Heat In” guide, sets recommended minimum insulation values by climate zone. For zone 6, the band that covers the St. John’s A reference station, the recommended nominal values are:
| Assembly | RSI | R-value |
|---|---|---|
| Roof or ceiling | 10.6 | 60 |
| Walls | 4.8 | 27 |
| Basement walls | 4.2 | 24 |
| Floor over unheated space | 7.1 | 40 |
These four numbers cover four different assemblies, not four versions of the same one, the ceiling figure is not interchangeable with the floor figure, and neither substitutes for the wall or basement wall number. Canada labels insulation by RSI, the metric measure of thermal resistance, with the R-value given alongside because that’s the number most homeowners recognize from product packaging sold across North America. Depth in inches isn’t listed here on purpose: how many inches deliver a given R-value depends entirely on the material, whether that’s fiberglass batt, blown cellulose, or spray foam, and that figure belongs on the bag or the roll, not on this page.
Treat these as recommended minimums, not a code mandate. The building code that actually governs new construction and major retrofits in Newfoundland and Labrador is set provincially and enforced municipally, and it can require more than NRCan’s baseline table. These figures also apply specifically to the zone 6 band represented by the St. John’s A station. A homeowner further north or further inland, sitting in a colder zone once their own municipality’s degree-days are checked, should expect to need more insulation than what’s listed above, not the same amount stretched to cover a wider range of winters.
Sealing comes before insulating
U.S. ENERGY STAR treats air sealing and insulation as two parts of a single project, and its own project guidance puts attic air sealing before attic insulation, every time. The reasoning is simple: insulation slows heat moving through a material, but it does nothing to stop air moving around it. Lay batts or blown-in fiberglass over a gap around a bathroom fan housing, a wiring penetration, or an unsealed chimney chase, and the insulation doesn’t close that gap. It just buries it, making the leak harder to find on the next inspection.
The recommended order of work runs like this:
- Seal the attic first, every penetration, chase, and gap where conditioned air can escape into the attic space.
- Add or top up attic insulation once the sealing is done and inspected.
- Seal and insulate the rim joist, where the foundation meets the floor framing.
- Address the floor over any unheated space, including crawlspaces.
- Only then move to the walls, which are the most disruptive and expensive part of the job to open up.
No published estimate separates out how much sealing alone is worth compared to insulation alone. The savings figure ENERGY STAR publishes covers both steps together, done in that order, and pulling one number out to represent just the sealing half would misstate what’s actually been measured. For the detail of how to carry out each of these steps, the national guides on this site cover attic air sealing and attic insulation installation on their own pages.
What the winter here actually asks for
Heating degree-days measure demand, not temperature. At roughly 4,755 a year for the St. John’s A station, Newfoundland’s capital sits in a climate that asks for sustained, months-long heating rather than short cold snaps followed by mild stretches. That number is a workload figure: roughly twice the degree-days means roughly twice the fuel burned to hold the same house at the same indoor temperature, all else being equal.
What homes in the province actually heat with matters as much as the degree-day count. Statistics Canada’s 2023 survey of primary heating systems puts electric baseboard heaters at 56 percent of homes in Newfoundland and Labrador, by far the largest single category. Forced-air furnaces account for 9 percent, boilers with hot-water or steam radiators for 6 percent, and heat pumps for 8 percent. The figure for heating stoves is not reported, the survey’s estimate was suppressed as unreliable, which is not the same thing as saying nobody heats with a stove.
That equipment mix changes where insulation dollars do the most good. A province where forced-air furnaces and ductwork dominate has a real problem with ducts routed through unconditioned attics, since every foot of uninsulated or leaky ductwork up there bleeds heat that ceiling insulation alone never touches. In Newfoundland and Labrador, where furnaces make up only 9 percent of primary systems and electric baseboard rules the majority of homes, that particular duct-and-attic loss affects a much smaller share of houses than it would in a furnace-heavy region. For the homes that do run forced air, though, the same problem applies in full, and the duct sealing and duct insulation guides on this site are worth a look before touching the ceiling insulation.
The practical order for most homes in the province, given this mix, looks like:
- Seal and insulate the attic to the zone 6 minimum, since ceiling heat loss affects every heating system equally.
- Check the rim joist and any accessible basement wall for missing insulation.
- If the home runs forced air, inspect and seal ductwork in the attic before adding more ceiling insulation over it.
- For electric baseboard homes, focus remaining effort on floor insulation over unheated crawlspaces, since there’s no ductwork loss to chase.
What the work is worth
U.S. ENERGY STAR’s own published estimate reads: “EPA estimates that homeowners can save an average of 15% on heating and cooling costs (or an average of 11% on total energy costs) by air sealing their homes and adding insulation in attics, floors over crawl spaces, and accessible basement rim joists.” Both percentages matter together : 15 percent applies specifically to heating and cooling costs, while 11 percent applies to total energy costs, which include everything else running through a home’s meter.
These are averages built from energy modeling of a typical existing U.S. home, not a guarantee tied to any one house in St. John’s, Corner Brook, or Happy Valley-Goose Bay. The modeling also names its scope precisely: attics, floors over crawl spaces, and accessible basement rim joists. It says nothing about walls, windows, or doors, and stretching the figure to cover those assemblies isn’t supported by the source.
It’s worth keeping this number separate from two others that sound similar but measure different things. ENERGY STAR’s own program landing page advertises “up to a 10% savings on your annual energy bills” for the same general work, phrased as a ceiling rather than an average. The U.S. Department of Energy also publishes a 10 percent figure, but that one refers to a thermostat setback of 7 to 10 degrees Fahrenheit held for eight hours a day, which has nothing to do with insulation at all. Three real numbers, three different claims, and only the first one, 15 percent of heating and cooling costs or 11 percent of total energy costs, actually describes what air sealing and insulation do.