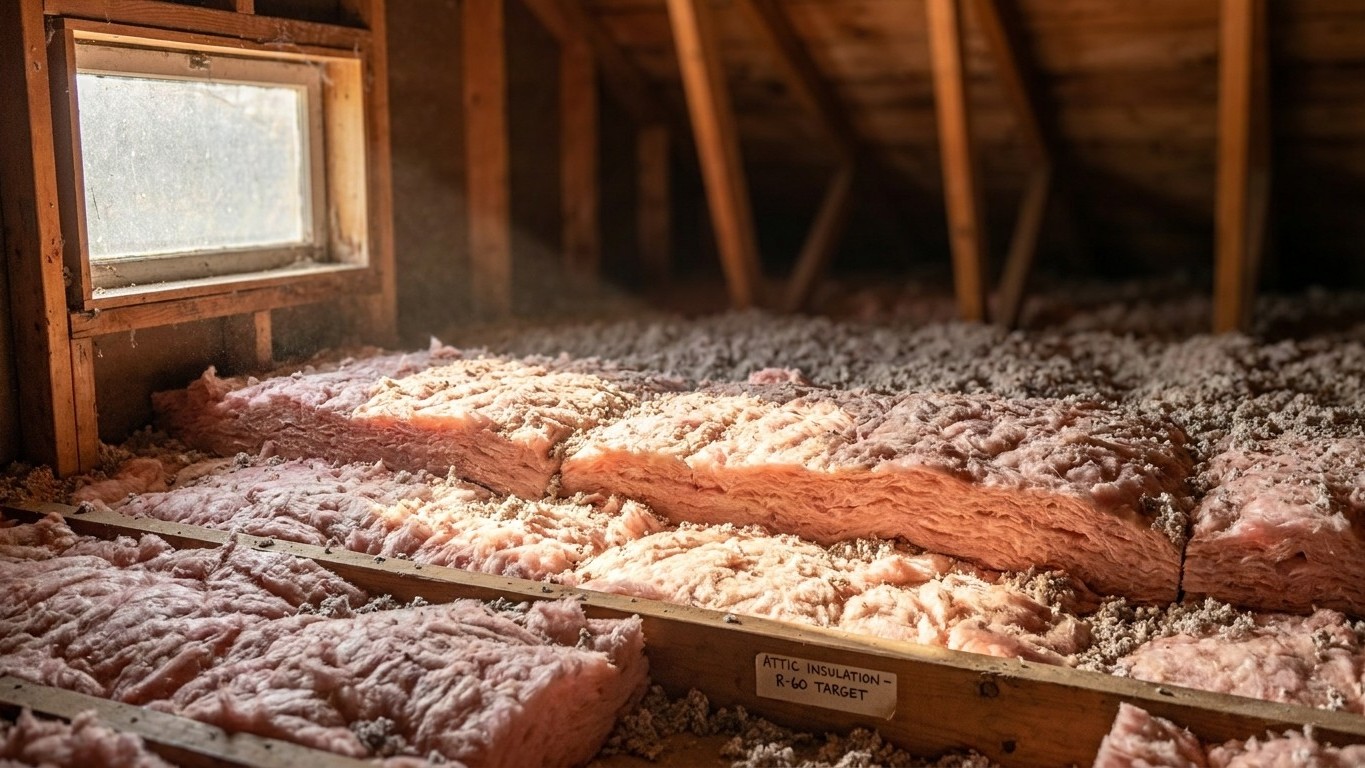

West Virginia doesn’t have one insulation answer. The state sits across two IECC climate zones, so the right R-value depends on which of the state’s 55 counties a home sits in. Once you know the zone, the ENERGY STAR retrofit table gives a straight answer for the attic and the floor, no guesswork required.
Which climate zone West Virginia is in

West Virginia’s 55 counties split between two IECC climate zones: 36 counties fall in zone 4A, and 19 counties fall in zone 5A. That’s the split according to the 2021 International Energy Conservation Code, and it means there’s no single climate zone for the state the way some states get to claim. A reader in one of the 36 zone 4A counties and a reader in one of the 19 zone 5A counties are working from different rows of the insulation table, and neither number describes the whole state.
| Climate zone | Number of counties |
|---|---|
| 4A | 36 counties |
| 5A | 19 counties |
Worth being precise here: a count of counties is not a share of population. Thirty-six counties in one zone doesn’t mean thirty-six times the housing stock or thirty-six times the energy demand of the other nineteen. A single county with a mid-sized city can hold more households than a dozen rural counties combined. This table tells you how the zones are distributed geographically across the state, not how many people live under each one.
What a climate zone actually measures
An IECC climate zone is a shorthand for how much a building has to fight the outside air over a year, built from long-term temperature data at the county level. The number (4, 5, and so on) tracks how cold and how long the winter runs; a higher number means a harder winter. The letter that follows it, in West Virginia’s case always an A, marks the moisture regime: A stands for moist, B for dry, C for marine. Zones 7 and 8, reserved for the coldest parts of the country, don’t carry a letter at all. That letter matters here because the ENERGY STAR insulation table groups zones by letter as well as number, and a 4A county gets grouped differently than a 5A county even though both start with the same digit range.
This page won’t tell you which of the two zones your own county falls into, because getting that wrong means buying the wrong amount of insulation. County-level zone assignments are published in the IECC’s official table, and ENERGY STAR also publishes a zone map. Check either one against your county before you shop, then come back to the table below to see what that zone actually calls for.
The insulation levels that apply here
ENERGY STAR publishes recommended insulation levels for retrofitting existing wood-framed homes, based on the 2021 IECC. The table below is easy to misread at a glance: each zone lists three numbers, but they aren’t three attic figures. Two of them cover the attic, split by starting condition, and the third is the floor. Reproduced with the source’s own labels, it looks like this:
| Zone | Attic if UNINSULATED | Attic if you ALREADY HAVE 3-4 inches | Floor |
|---|---|---|---|
| Zone 1 | R30 | R25 | R13 |
| Zone 2 | R49 | R38 | R13 |
| Zone 3 | R49 | R38 | R19 |
| Zones 4A and 4B | R60 | R49 | R19 |
| Zones 6, 5, and 4C | R60 | R49 | R30 |
| Zones 7 and 8 | R60 | R49 | R38 |
For West Virginia, two rows apply, and only two. The 36 counties in zone 4A fall under the “Zones 4A and 4B” row: R60 for an uninsulated attic, R49 if there’s already 3-4 inches down, and R19 for the floor. The 19 counties in zone 5A fall under the “Zones 6, 5, and 4C” row instead, which asks for the same attic numbers, R60 or R49 depending on starting point, but a heavier R30 floor. The difference between the two rows is entirely in the floor requirement; a home in a zone 5A county over a crawl space or unheated basement needs meaningfully more floor insulation than one in a zone 4A county, even though the attic target is identical.
Don’t split the difference between the two rows to land on a single statewide figure. Averaging R60/R19 and R60/R30 to get something in between would produce a number that fits neither zone, which is exactly the mistake this table exists to prevent. And don’t try to translate any of these R-values into a depth in inches. Depth depends on the material, fiberglass batts, blown cellulose, and spray foam all reach the same R-value at different thicknesses, so the actual figure is on the product packaging, not in this table. These levels are retrofit targets for existing wood-framed buildings, not the code minimum for new construction, which is a separate and generally higher bar.
Sealing comes before insulating
ENERGY STAR treats air sealing and insulation as two halves of one job, not two separate projects, and its own guidance puts attic air sealing ahead of attic insulation in the sequence. The reasoning is straightforward: insulation slows heat moving through a material, but it does nothing to stop air moving around it. Lay batts or blown-in insulation over a gap around a recessed light, a plumbing stack, or a chimney chase, and you’ve buried the leak instead of closing it. The insulation now hides the problem from a visual inspection while the air keeps moving through it.
Working through a home in the right order avoids that trap. ENERGY STAR’s own sequence runs like this:
- Seal air leaks in the attic first, before any new insulation goes in
- Add or top up attic insulation to the target level for the zone
- Seal and insulate the rim joist, where the foundation meets the framing
- Address the floor over a crawl space or unconditioned basement
- Move to wall sealing and insulation last
One number to be careful with: the widely cited savings estimate for this kind of work covers sealing and insulating together, as a combined project. There’s no separate published figure for air sealing done on its own, so resist the temptation to attach a percentage to that first step by itself. For the specifics of how each of these steps gets done, attic sealing techniques, rim joist detailing, crawl space approaches, this site’s national insulation guides walk through the mechanics in more depth than a state-level page needs to.
What the winter here actually asks for
The reference station at Charleston Yeager Airport logs about 4,353 heating degree days a year, against roughly 1,162 cooling degree days, using NOAA’s 1991-2020 climate normals. Degree days aren’t a temperature reading; they’re a running tally of how far the average daily temperature fell below 65°F, added up across the whole year. A bigger number means more total heating demand, and at more than triple the cooling degree day count, Charleston’s year runs as a heating-dominated climate, not a cooling-dominated one. That’s one station, though, and a mountain county elsewhere in the state can run considerably colder than the state’s capital.
What that demand actually runs on matters just as much as how much of it there is. Federal survey data for West Virginia shows 54% of homes using a furnace as their main heating equipment, and 20% using a central heat pump; the share using a steam or hot-water boiler wasn’t published, the estimate was suppressed as unreliable, not zero. On fuel, 43% of homes run on natural gas and 45% on electricity, while fuel oil, kerosene, and propane figures were all not reported in that survey. Those “not reported” categories mean there wasn’t enough reliable sample data to publish a number, not that nobody in the state uses that fuel.
A state built mostly around furnaces pushing warm air through ductwork carries a specific risk that a boiler-and-radiator home doesn’t: ducts routed through an unconditioned attic lose heat straight into that attic space, and no amount of ceiling insulation fixes a leaky duct run above it. With just over half of West Virginia homes on furnace heat, that’s a real priority for a meaningful share of the state’s housing stock. Given the degree day count and the heating mix, the practical order of attention looks like this:
- Seal and insulate the attic to the level for your zone (4A or 5A)
- Check ductwork routed through unconditioned attics or crawl spaces for leaks and missing insulation
- Address rim joists and floors, especially where 5A’s higher R30 floor target applies
- Move to wall sealing once the above are handled
For homes on ducted furnace systems, the duct guides elsewhere on this site cover sealing and insulating that ductwork in the detail this section doesn’t have room for.
What the work is worth
ENERGY STAR’s own methodology page states it directly: “EPA estimates that homeowners can save an average of 15% on heating and cooling costs (or an average of 11% on total energy costs) by air sealing their homes and adding insulation in attics, floors over crawl spaces, and accessible basement rim joists.” Both numbers matter, and so does what each one is measured against. Fifteen percent applies to heating and cooling costs specifically; eleven percent applies to total energy costs, a broader category that includes things like water heating and appliances that sealing and insulation don’t touch.
These are averages pulled from energy modeling of a “typical” existing U.S. home, not a guarantee tied to any particular house. And the claim is scoped to specific locations: attics, floors over crawl spaces, and accessible basement rim joists. It doesn’t extend to walls, windows, or doors, even though those are common places homeowners assume insulation upgrades pay off. If a wall retrofit is on the table, that’s a different project with its own math, not covered by this figure.
It’s also worth keeping this number separate from two others that sound similar but aren’t the same claim. ENERGY STAR’s program landing page separately advertises “up to a 10% savings on your annual energy bills” for the same category of work, an “up to” figure against a different baseline than the 15%/11% pair above. And the Department of Energy’s commonly cited 10% figure has nothing to do with insulation at all; it’s tied to a thermostat setback of 7 to 10 degrees held for eight hours a day. Three real numbers, three different claims, and conflating them is how an accurate figure turns into a misleading one.