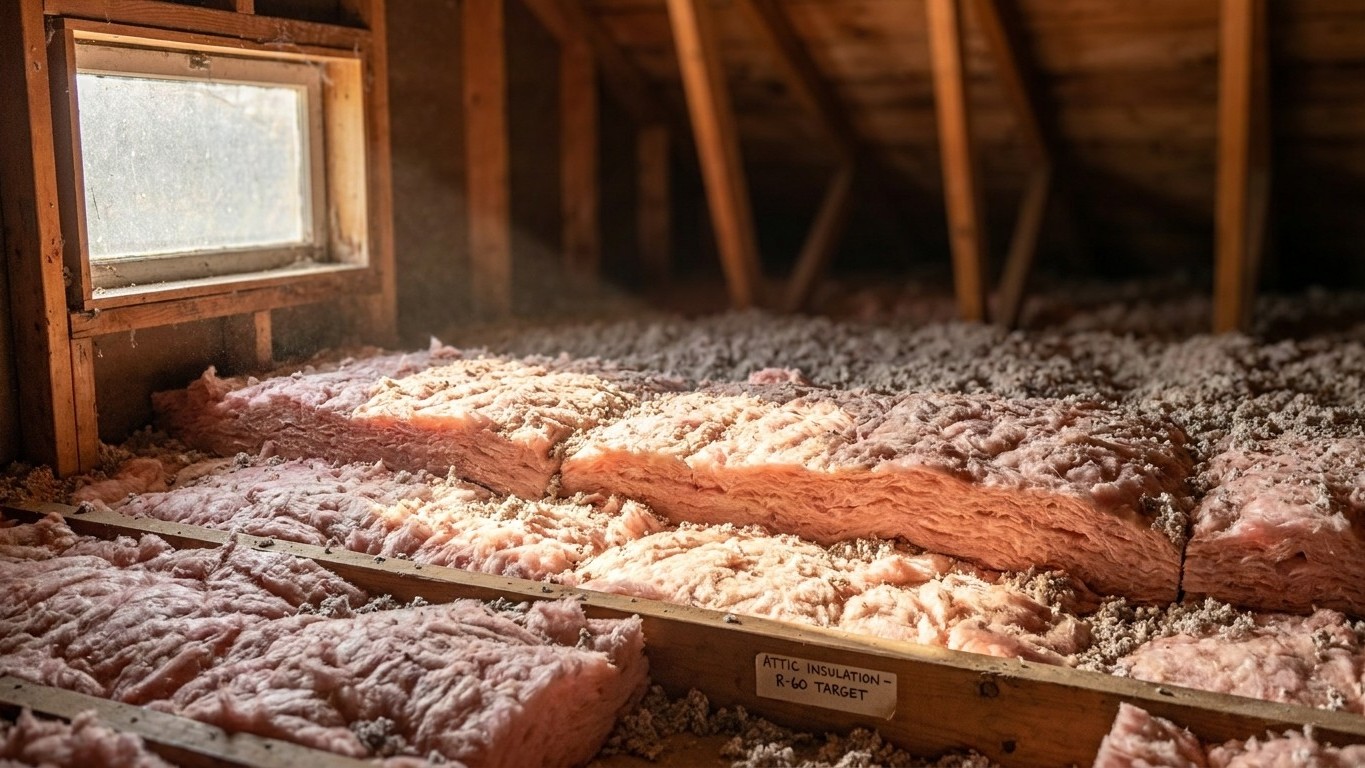

Arizona doesn’t have one Insulation answer. The state spans four separate climate zones across its 15 counties, which means the right attic and floor R-values for a home near Yuma look nothing like what’s recommended for a home in Coconino County. Here’s how to find your zone and read the numbers that follow.
Which climate zone Arizona is in

There is no single climate zone for Arizona. The 2021 International Energy Conservation Code, the reference used to assign these zones county by county nationwide, splits the state four ways. That table is the same one Insulation contractors and building departments use to decide what an existing home should have in its attic and floor.
| IECC Climate Zone | Counties in this zone |
|---|---|
| Zone 3B | 5 counties |
| Zone 2B | 5 counties |
| Zone 5B | 3 counties |
| Zone 4B | 2 counties |
That’s 15 counties spread across four zones, and it’s worth being precise about what those numbers mean. A county count is not a population count. Five counties in zone 2B doesn’t tell you whether that’s a fifth of the state’s residents or half of them, only that five counties carry that designation. The same caution applies in reverse: a state can have most of its counties in one zone and most of its people in another. Don’t assume the zone with the most counties is the one that affects the most homes.
A climate zone number describes how much heating or cooling demand a location typically carries over a year, with lower numbers meaning milder winters and higher numbers meaning colder ones. The letter that follows the number is a moisture regime: A means moist, B means dry, and C means marine. Zones 7 and 8, which don’t apply anywhere in Arizona, don’t carry a letter at all. That letter isn’t decorative. The Insulation table in the next section groups some zones together specifically because of it, so a home in a “4B” county follows a different row than one in a “4A” county elsewhere in the country, even though the number is the same.
Because Arizona spans four zones and letters, there’s no way to give one R-value recommendation that fits the whole state. This page won’t try to guess which zone your county falls into. The IECC table linked above lists every Arizona county by name, and cross-referencing it against your address is the reliable way to know which row of the insulation chart in the next section actually applies to your home.
The insulation levels that apply here
The U.S. Environmental Protection Agency’s ENERGY STAR program publishes retrofit insulation levels by climate zone, built on the 2021 IECC’s residential provisions. These are recommendations for adding insulation to an existing wood-framed house, not requirements for new construction, and they cover attics and floors specifically.
The table has a detail that trips a lot of readers up: the “attic” recommendation is actually two separate numbers, one for an attic with no insulation at all and one for an attic that already has 3 to 4 inches in place. The floor figure is a third, distinct column. Three numbers per zone, but only two of them describe the attic.
| Zone | Attic if UNINSULATED | Attic if you already have 3-4 inches | Floor |
|---|---|---|---|
| Zone 1 | R30 | R25 | R13 |
| Zone 2 | R49 | R38 | R13 |
| Zone 3 | R49 | R38 | R19 |
| Zones 4A and 4B | R60 | R49 | R19 |
| Zones 6, 5 and 4C | R60 | R49 | R30 |
| Zones 7 and 8 | R60 | R49 | R38 |
Given Arizona’s spread across zones 2B, 3B, 4B, and 5B, four rows of this table matter somewhere in the state. A county in zone 2B follows the “Zone 2” row: R49 for an uninsulated attic, R38 if 3 to 4 inches are already there, R13 at the floor. A county in zone 3B follows “Zone 3,” calling for R49, R38, and R19 at the floor. Zone 4B counties fall under “Zones 4A and 4B,” which pushes the attic recommendation to R60 or R49 and keeps the floor at R19. And zone 5B counties fall under “Zones 6, 5 and 4C,” the same R60/R49 attic figures but a floor recommendation of R30, more than double what a zone 2B home needs underfoot.
That’s a real spread. A homeowner in the north of the state and one near the Colorado River border are not shopping for the same amount of material, even though they live in the same state and might see the same big-box insulation display. Don’t average these figures to land on one number for “Arizona.” That’s precisely the mistake this kind of state-by-state guidance tends to produce, and it leaves some homes underinsulated while pushing others to buy more than their zone calls for. None of these R-values translate to a fixed depth in inches, either. That depth depends on which material you’re using, and it’s printed on the product’s own packaging, not on this chart.
Sealing comes before insulating
ENERGY STAR treats air sealing and insulation as two halves of one project, not two separate options, and its own guidance puts attic air sealing ahead of attic insulation in the sequence of work. That order isn’t arbitrary.
Insulation slows heat moving through a material. It does nothing to stop air moving around or through gaps, cracks, and penetrations. Lay batts or blown-in insulation over an unsealed attic floor and you haven’t closed those leaks, you’ve buried them under material that makes them harder to find later.
The practical order of work looks like this:
- Seal the attic first, closing gaps around plumbing stacks, wiring penetrations, chimney chases, and the top plates of interior walls.
- Add or upgrade attic insulation to the level called for by your climate zone.
- Seal and insulate the rim joist, the band around the perimeter of the house where the foundation meets the framing.
- Address the floor or crawlspace, following the floor R-value from the table above.
- Only after those steps, move to wall insulation.
Notice that walls come last, not first. For a lot of homeowners that’s counterintuitive, since walls are the surfaces you actually touch and think about day to day. But attics, rim joists, and floors are where air moves most freely and where heat loss tends to concentrate in an older house. Any savings figure ENERGY STAR publishes for this kind of project covers sealing and insulating together as one job, not sealing on its own, so don’t expect a standalone number for just closing the gaps. For the specifics of how to seal each of these areas, the general insulation guides on this site walk through the techniques step by step rather than repeating them here.
What the winter here actually asks for
Heating degree days measure demand, not temperature. The figure adds up, for every day of the year, how far the average temperature fell below 65°F, and it’s a stand-in for how much fuel a furnace or heat pump has to burn to keep a house comfortable. At Phoenix Sky Harbor International Airport, the 1991-2020 NOAA climate normal comes out to about 874 heating degree days a year, against roughly 4,765 cooling degree days at the same station. That ratio tells you plainly which season does the heavy lifting on an Arizona energy bill, and it isn’t winter.
But 874 heating degree days is still a real number, not zero, and it’s a single reference-station figure. A mountain county elsewhere in the state can run considerably colder than Phoenix, so this number describes the low desert, not the whole state.
What Arizona homes actually use to generate that heat is worth knowing too. Federal survey data from the Energy Information Administration’s 2020 Residential Energy Consumption Survey shows 55% of Arizona homes rely on a furnace, and 25% run a central heat pump. Steam or hot-water boiler use wasn’t reported in the survey, meaning the sample found too few households running that equipment to publish a reliable figure, not that no one in the state has one. By fuel source, natural gas heats 36% of homes and electricity powers 51%, with propane at 2% and fuel oil or kerosene suppressed as an unreliable estimate.
That furnace-and-electricity mix matters for where insulation dollars do the most good. A state dominated by boilers and radiators loses heat through different paths than one where most homes push warm air through ductwork. In Arizona, with furnaces leading and ducts commonly running through unconditioned attic space, sealing and insulating the attic addresses only part of the loss if the ductwork itself is leaky or uninsulated.
Given that mix, the local priority order looks like this:
- Seal the attic and bring it to the R-value your county’s zone calls for.
- Check attic ductwork for leaks and insulation, since ducts running through an unconditioned attic lose conditioned air before it reaches the living space.
- Address the floor or crawlspace insulation per the zone table.
- Seal accessible rim joists in homes with basements or raised foundations.
The duct-specific guides on this site cover sealing and insulating that ductwork in more detail, and they’re worth pairing with any attic project in a state where furnaces and forced air are this common.
What the work is worth
ENERGY STAR’s own methodology page puts a number on this kind of project: “EPA estimates that homeowners can save an average of 15% on heating and cooling costs (or an average of 11% on total energy costs) by air sealing their homes and adding insulation in attics, floors over crawl spaces, and accessible basement rim joists.”
Both percentages matter, and they’re not measuring the same thing. The 15% figure applies specifically to heating and cooling costs, the portion of an energy bill tied to running a furnace, air conditioner, or heat pump. The 11% figure is broader, covering total energy costs, which includes water heating, lighting, appliances, and everything else drawing power in a house. Quoting one number without its denominator turns an accurate figure into a misleading one.
These are averages pulled from energy modeling of a typical existing U.S. home, not a guarantee for any specific house. A home that’s already well-sealed and well-insulated won’t see anywhere near 15%, while a leaky, underinsulated older home might see more. The estimate also names exactly where the modeled work happened: attics, floors over crawl spaces, and accessible basement rim joists. It doesn’t extend to walls, windows, or doors, so don’t stretch this percentage to cover a whole-house renovation.
It’s also worth keeping this figure separate from two others that sound similar but aren’t. ENERGY STAR’s own program landing page cites “up to a 10% savings on your annual energy bills” for the same category of work, a different phrasing with a different denominator. The Department of Energy publishes a separate 10% figure tied to setting a thermostat back 7 to 10°F for eight hours a day, which has nothing to do with insulation at all. Three real numbers, three different claims, and conflating them is how good information turns into a rounding error nobody can trace back to its source.