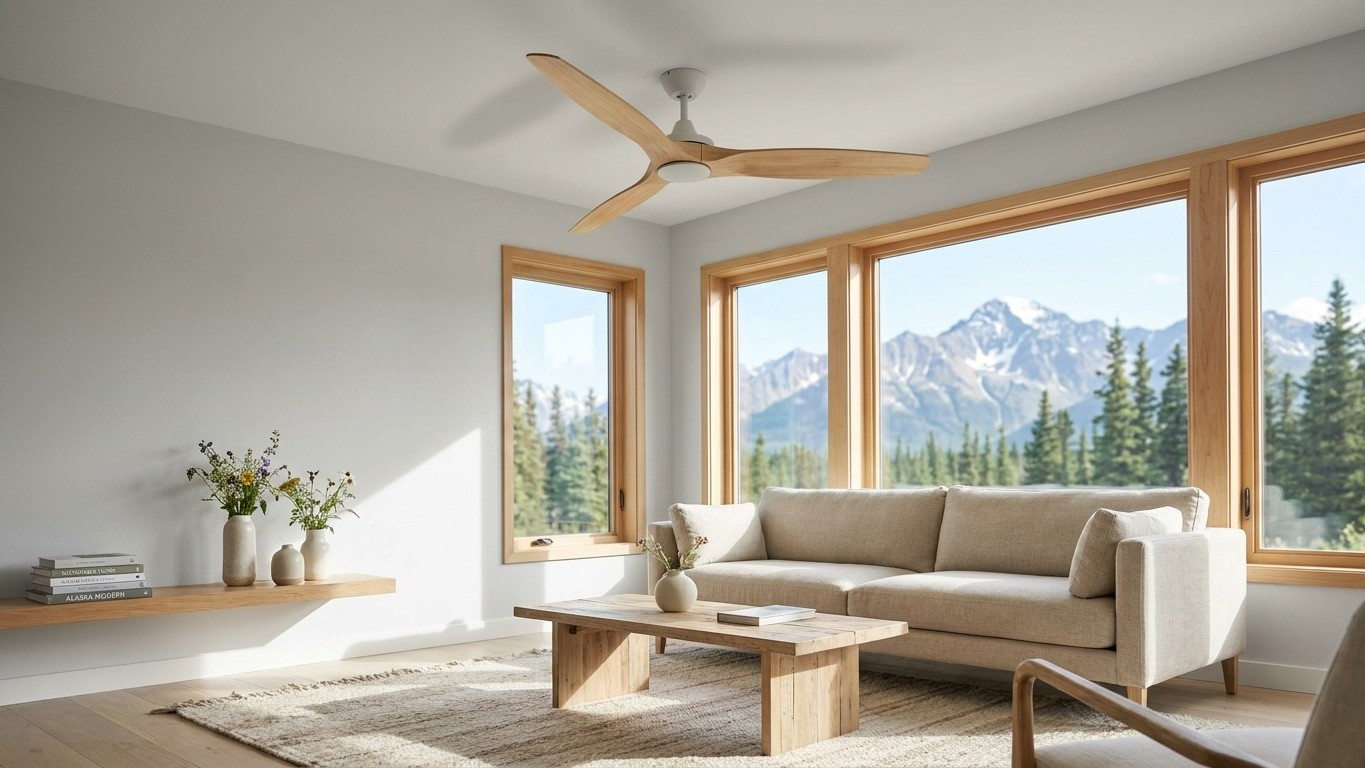

California’s homes cool with a mix of methods, not one dominant system. A slim majority run central air, a meaningful share gets by on window units, mini-splits, or portables, and ceiling fans turn up almost everywhere as backup. Which setup a house ends up with usually traces back to when it was built and how hot the local summer actually runs.
What homes in California actually cool with
The U.S. Energy Information Administration’s 2020 Residential Energy Consumption Survey puts real numbers on that mix. 72% of California homes use air-conditioning equipment of some kind, 54% run a central air-conditioning unit, and 23% rely on an individual unit, meaning a ductless mini-split, a window or wall unit, or a portable. Ceiling fans show up in 63% of homes, often working alongside whichever cooling system is installed rather than replacing it.
The gap between “has air conditioning” and “has central air” is exactly where that 23% individual-unit figure lives, and it’s worth seeing how differently that plays out elsewhere. Connecticut reports air conditioning in 90% of homes but central air in only 34%, meaning most of its cooling runs on window units and mini-splits. Alabama runs the opposite pattern: 94% with air conditioning and 81% of that on central systems. California sits between those two extremes, a state where central air edges out individual equipment but doesn’t dominate the way it does across much of the Southeast.
None of these shares are a recommendation. They reflect what got installed when the housing stock went up, and whether a house already had ductwork to work with. Older bungalows and postwar tract homes across the state often never got central systems retrofitted, which is a big part of why individual units still cool nearly a quarter of California households. A separate hub page on heating and cooling in California covers how that same pattern shows up on the heating side.
How much cooling the year actually asks for
NOAA’s Climate Normals for 1991-2020, measured at the Los Angeles reference station, put the mean count at 2.4 days a year reaching 90°F or more. That’s a count of days at one station, not a statewide average and not a measure of how hot the air typically feels. It’s the number that drives cooling demand, heat stress, and equipment run time near that station.
By that measure, California’s heat load looks mild, and the equipment mix roughly fits. A state with only 2.4 days a year hitting 90°F doesn’t need the aggressive, always-on cooling that pushes a housing market toward near-universal central air, and California’s 54% central share sits well short of what shows up in hotter, humid Southeast states. The catch is that this single reference station represents coastal Southern California, not the interior valleys or desert basins that regularly see far higher summer temperatures. A statewide equipment survey doesn’t split those regions out, so the 2.4-day figure and the 54%/23% split describe an average that papers over real differences between, say, a coastal neighborhood and an inland one a few hours east.
That’s the useful takeaway here: the heat-load number and the equipment mix line up reasonably well at the state level, but neither figure captures how much hotter conditions run once you leave the coast. A household in the Central Valley or the desert reads this same 2.4-day figure with real skepticism, and rightly so.
Wet heat or dry heat, and what it changes
Summer rainfall at the same reference station runs about 0.1 inch total across June, July, and August, against 12.2 inches for the year. August is the driest month at 0.0 inches, with June at 0.08 inch and July at 0.04 inch. That’s a measure of precipitation, not humidity, but it tells you plainly that California summers are dry, close to rainless at this station.
Dry summers change what an air conditioner is actually doing. Every AC unit performs two jobs at once: lowering the air temperature and pulling moisture out of it. Removing moisture takes run time, since the system has to keep cycling air across a cold coil long enough to condense water out of it. In a wet, muggy climate that drying job eats up a large share of the unit’s work, and an oversized unit that cools the air fast and shuts off never runs long enough to do it, leaving a room cold but clammy. In a dry summer like California’s, the moisture-removal job is nearly nonexistent, so nearly all the unit’s work is straightforward temperature drop.
That changes what’s worth paying attention to here:
- Size the unit to the room, not to worst-case heat, since dry air doesn’t punish undersizing the way humid climates do.
- Run the fan through the afternoon peak instead of short bursts, because there’s little moisture load fighting against steady airflow.
- Save any dehumidify setting for the rare muggy stretch, such as monsoon moisture pushing into the southeastern desert, rather than building a routine around it.
Sizing a room unit, from the published chart
ENERGY STAR publishes a straightforward starting chart for sizing a room air conditioner, matching square footage to cooling capacity in BTUs per hour:
| Area to be cooled (sq. ft.) | Capacity needed (BTU/hr) |
|---|---|
| 100 up to 150 | 5,000 |
| 150 up to 250 | 6,000 |
| 250 up to 300 | 7,000 |
| 300 up to 350 | 8,000 |
| 350 up to 400 | 9,000 |
| 400 up to 450 | 10,000 |
| 450 up to 550 | 12,000 |
| 550 up to 700 | 14,000 |
| 700 up to 1,000 | 18,000 |
| 1,000 up to 1,200 | 21,000 |
| 1,200 up to 1,400 | 23,000 |
This chart is a starting point for a single room unit, sourced directly from ENERGY STAR’s room air conditioner guidance. It doesn’t size a central system, which needs a proper load calculation that accounts for insulation, windows, and duct layout, not just floor area. That distinction matters most in California, where 23% of homes run on individual units like the ones this chart is built for, while the 54% on central air need a different sizing process entirely. Going a size up “for margin” is the wrong instinct either way: an oversized unit cools the room fast, shuts off, and never runs long enough to pull moisture out of the air, leaving things cold and clammy rather than efficient.
What actually needs looking after here
With 23% of California homes running individual equipment and 54% running central systems, maintenance advice really does split by which one is installed. For a house on window units or a mini-split, there’s no ductwork to worry about at all, and the upkeep starts and ends with the unit itself. For a house on central air, ducts are part of the system and part of what can go wrong.
ENERGY STAR’s baseline advice applies across both: “Inspect, clean, or change air filters once a month in your central air conditioner, furnace, and/or heat pump.” That’s once a month, not once a season, and it covers all three pieces of equipment together, which matters for anyone who assumed filter care was a furnace-only chore. The payoff for skipping it is real: ENERGY STAR notes that “airflow problems can reduce your system’s efficiency by up to 15 percent,” which is a meaningful loss from a system that’s otherwise working exactly as designed.
For the 54% of California homes running central air, there’s a second thing worth checking: the ducts themselves. ENERGY STAR states that “in a typical house, however, about 20 to 30 percent of the air that moves through the duct system is lost due to leaks, holes, and poorly connected ducts.” That’s air conditioned at real cost, leaking into an attic or crawlspace before it ever reaches a vent, and it’s a big reason a system can be running fine and still leave a room warmer than it should be.
A reasonable seasonal pass, adjusted for which system is at the house:
- Check or change filters monthly, on both central systems and individual units, through the cooling season.
- Before the first hot stretch, have a central system’s ducts inspected for the leaks ENERGY STAR describes, since sealing them recovers real capacity without buying new equipment.
- On individual units, confirm the unit is sized to the room using the ENERGY STAR chart rather than defaulting to the next size up.
These same figures play out differently elsewhere in the cocon: homes in Georgia lean far more heavily on central air, while New Jersey shows its own split between central and individual equipment worth comparing against California’s numbers.