
Vancouver Int’l A, the reference weather station most often used for the coast, sits in NRCan climate zone 4, with about 2,818 heating degree days a year below 18°C. For that zone, Natural Resources Canada recommends RSI 7.9 (R 45) at the roof or ceiling, RSI 3.9 (R 22) at walls, RSI 3.3 (R 19) at basement walls, and RSI 6.2 (R 35) at floors over unheated space. Other parts of the province sit in colder zones and need more.
Which climate zone British Columbia is in

British Columbia does not have one climate zone. Natural Resources Canada sets zones by annual heating degree-days measured below 18°C, and the province’s geography, from wet coastline to interior plateau to northern mountains, spans several of them. The figure verified for this page comes from one station only: Vancouver Int’l A, with roughly 2,818 heating degree days a year, which lands it in Zone 4, the mildest band NRCan uses for a Canadian location.
That is a fact about one airport, not a fact about the province. A community a few hundred kilometers inland, or a few hundred meters higher in elevation, can rack up degree days at a much faster rate and sit in Zone 5, 6, or higher. NRCan draws the lines this way:
| Zone | Annual heating degree-days (below 18°C) |
|---|---|
| 4 | Under 3,000 |
| 5 | 3,000-3,999 |
| 6 | 4,000-4,999 |
| 7a | 5,000-5,999 |
| 7b | 6,000-6,999 |
| 8 | Over 7,000 |
A climate zone is simply a shorthand for how much heating a typical year demands at a given location. The higher the number, the colder the climate and the more Insulation NRCan recommends. Zone 7 is the only one split further, into 7a and 7b, purely by degree-day count, not by moisture or coastal exposure. That’s a difference worth flagging for anyone who has seen American energy codes: the IECC system used south of the border tags some zones with a letter for moisture regime (moist, dry, marine), while the NRCan system used here does not. Zone 7’s a/b split is about degree-days alone.
None of this tells an individual reader which zone covers their own address. Before buying insulation, look up the heating degree-days for your own municipality or the nearest Environment and Climate Change Canada station, and compare it against the table above. A homeowner in Prince George is not shopping for the same product as one in Victoria, even though both are technically “in British Columbia.”
The insulation levels that apply here
For Zone 4, the zone the Vancouver Int’l A station sits in, Natural Resources Canada’s “Keeping the Heat In” guide recommends the following minimum insulating values for a house being upgraded:
| Building assembly | Recommended minimum (RSI) | Recommended minimum (R-value) |
|---|---|---|
| Roof or ceiling | RSI 7.9 | R 45 |
| Walls | RSI 3.9 | R 22 |
| Basement walls | RSI 3.3 | R 19 |
| Floor over unheated space | RSI 6.2 | R 35 |
These are nominal insulating values and they are stated as recommended minimums, not as a code requirement. British Columbia’s actual building code, applied provincially and enforced at the municipal level, can and often does ask for more than this table, especially in newer construction. Treat this table as a floor to check your existing insulation against, not a ceiling to design toward.
Notice that RSI comes first here, ahead of the R-value. That ordering matters because Canadian insulation is labeled in RSI on the package; the R-value is printed alongside it as the more familiar cross-reference, but RSI is the number the Canadian standard is actually built on.
These four figures apply to Zone 4, the zone tied to the Vancouver Int’l A station. If your municipality’s own heating degree-day count places it in Zone 5 or higher, per the table in the previous section, none of these four numbers are your target: NRCan’s guide sets higher minimums for every colder zone, and this page is not the place to guess at them by averaging. A reader in the north of the province and a reader on southern Vancouver Island are not shopping for the same wall assembly, and no single number on this page should be stretched to cover both.
Sealing comes before insulating
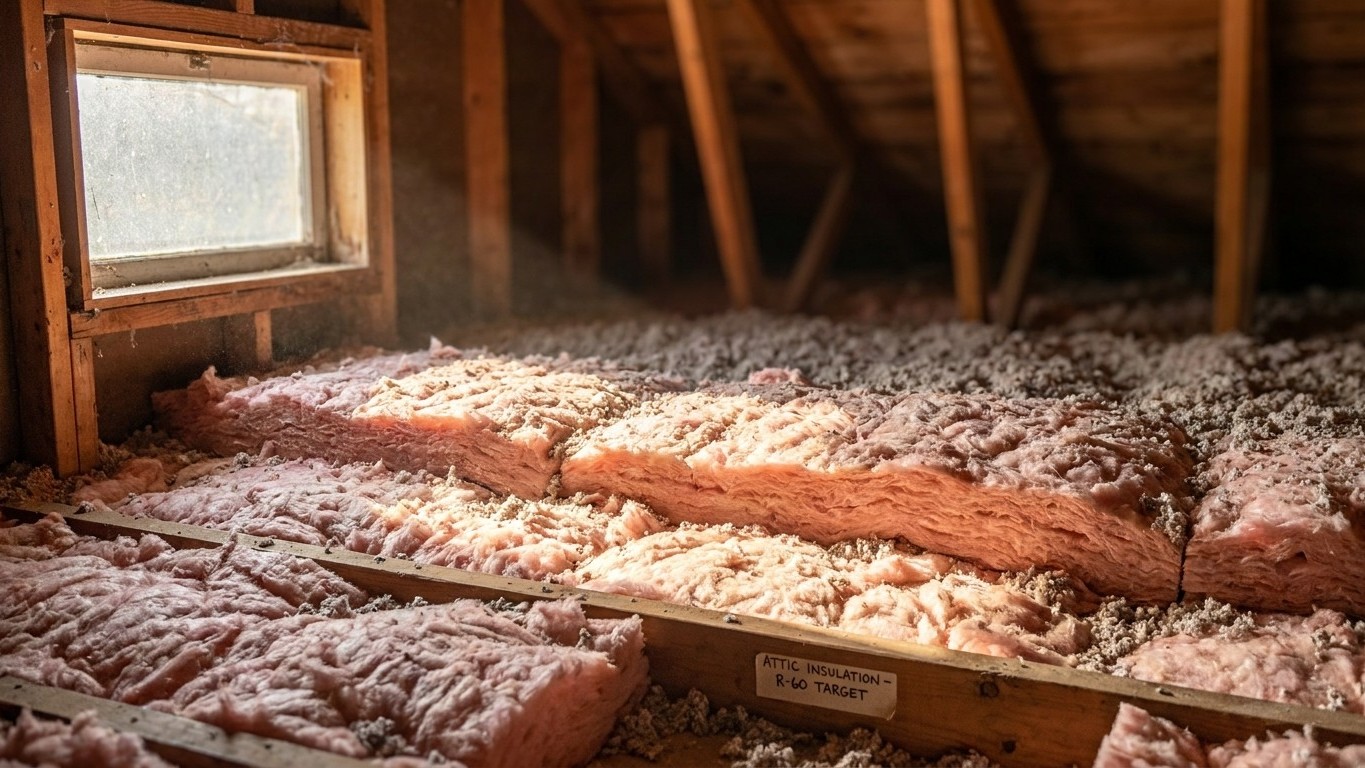
U.S. ENERGY STAR, whose home-improvement guidance is widely used across North America for the mechanics of the work, treats air sealing and insulation as two parts of one project, and its own project pages put attic air sealing first, before attic insulation goes in.
The reason is straightforward. Insulation slows heat moving through a material, whether that’s fiberglass batts, blown cellulose, or rigid foam. It does nothing to stop air moving around that material, through gaps, cracks, and penetrations. Lay insulation over an unsealed attic and you haven’t closed those leaks, you’ve hidden them under a blanket, where they keep losing heat and become much harder to find later.
The recommended order of work runs like this:
- Seal air leaks in the attic first, around plumbing stacks, wiring penetrations, chimney chases, and the top plates of interior walls.
- Add or top up attic insulation to the recommended level once sealing is done.
- Address the rim joist, one of the most commonly overlooked leak points in a house.
- Insulate the floor over unheated space or the crawlspace.
- Only then move to wall insulation, which is more disruptive and typically the last step tackled in a retrofit.
The published savings estimates for this kind of work cover sealing and insulation together as one combined project, not sealing by itself. For the mechanics of each of these five steps, including how to find leaks and what materials suit each cavity, the national insulation guides on this site walk through the detail that doesn’t belong in a province-level overview.
What the winter here actually asks for
The Vancouver Int’l A station logs about 2,818 heating degree days a year below 18°C. That figure measures demand, not Temperature: it’s an accumulated tally of how many degree-days the outdoor air spent below the comfort threshold over the year, and it’s the number that determines how much fuel a given house burns to stay warm. Twice the degree days means roughly twice the fuel for the same building, all else equal.
What British Columbia homes actually heat with, province-wide, shapes which parts of this demand matter most. According to Statistics Canada’s 2023 survey of primary heating systems, 36% of homes in the province rely on a forced-air furnace, 28% use electric baseboard heaters, 10% use a heat pump, and 9% use a boiler with hot-water or steam radiators. The share heating primarily with a wood or heating stove was not reported in that survey, an estimate suppressed as unreliable rather than a sign that nobody heats that way.
That equipment mix changes where the priorities sit. In a forced-air home, ductwork often runs through an unconditioned attic or crawlspace, and every foot of uninsulated, unsealed duct up there is heat leaking out before it ever reaches a room, a loss that piling more insulation at the ceiling plane does nothing to fix. In a home on electric baseboards or a hydronic boiler, there’s no duct run to lose heat along the way, so the building envelope itself, walls, ceiling, and floor, carries more of the weight.
Given that heating mix, a sensible order of local priorities looks like this:
- Seal and insulate the attic first, since it’s the largest and most common heat-loss surface across all heating types.
- Check duct insulation and sealing in any forced-air system before assuming the ceiling insulation alone will solve a cold room.
- Address the rim joist and floor over unheated space, particularly relevant for older housing stock on crawlspaces.
- Bring wall insulation up toward the Zone 4 minimum, or the appropriate colder-zone minimum, as the last major step.
Where ductwork runs through unconditioned space, the duct-specific guides on this site cover sealing and insulating that run in more detail than a province page can.
What the work is worth
U.S. ENERGY STAR’s own methodology states it directly: “EPA estimates that homeowners can save an average of 15% on heating and cooling costs (or an average of 11% on total energy costs) by air sealing their homes and adding insulation in attics, floors over crawl spaces, and accessible basement rim joists.”
Both numbers matter, and they measure different things. Fifteen percent is the average saving on heating and cooling costs specifically. Eleven percent is the average saving on total energy costs, a larger and more forgiving denominator that includes everything else a household pays for energy, not heating and cooling alone. Quoting one figure without its matching denominator turns an accurate estimate into a misleading one.
These are averages, drawn from energy modeling of a “typical” existing U.S. home, not a projection for any specific house in British Columbia. The modeling also names precisely where this work was done: attics, floors over crawl spaces, and accessible basement rim joists. It does not cover wall insulation, windows, or doors, and stretching the 15% or 11% figure to those parts of a house isn’t supported by what was actually modeled.
It’s also worth keeping this figure separate from two others that sound similar but aren’t. ENERGY STAR’s own program landing page cites “up to a 10% savings on your annual energy bills” for the same category of work, a different phrasing on a different denominator. The U.S. Department of Energy’s 10% figure, elsewhere, refers to a thermostat setback of 7-10°F held for eight hours a day, and has nothing to do with insulation work at all. Three real numbers, three separate claims, none of them interchangeable with the others.