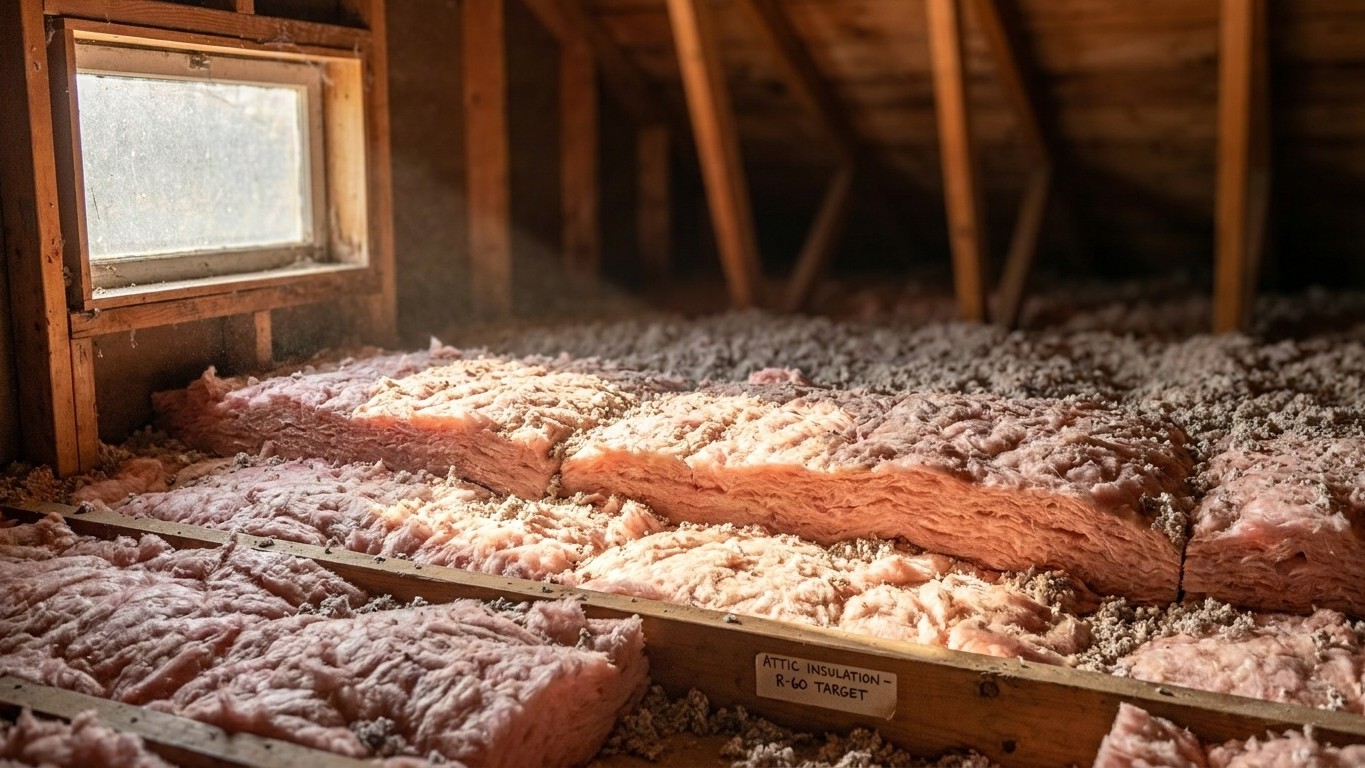

Alberta’s official reference point sits in NRCan climate zone 6, based on the Calgary International Airport weather station, which logs about 4,979 heating degree days below 18°C a year. For that zone, Natural Resources Canada recommends RSI 10.6 (R 60) in the ceiling, RSI 7.1 (R 40) in floors over unheated space, RSI 4.8 (R 27) in walls, and RSI 4.2 (R 24) in basement walls. But that number comes from one station, not from the whole province.
Which climate zone Alberta is in

The Calgary Int’l A station, with its roughly 4,979 annual heating degree days below 18°C, lands squarely in NRCan’s climate zone 6. That’s the figure Natural Resources Canada uses in its own reference guide, “Keeping the Heat In,” and it’s the number this page builds from. It is not, however, a statement about Edmonton, Fort McMurray, Lethbridge, or any other Alberta municipality. It’s the zone of one weather station near Calgary.
Natural Resources Canada sets its zones by counting heating degree days, a running tally of how far and how long the outdoor temperature sits below 18°C over a year. The more degree days a location racks up, the colder its climate demand and the higher the zone number. Zone 4 covers places under 3,000 heating degree days a year. Zone 5 runs from 3,000 to 3,999. Zone 6, where the Calgary station sits, spans 4,000 to 4,999. Above that, zone 7 splits into 7a (5,000 to 5,999) and 7b (6,000 to 6,999), and zone 8 covers anything over 7,000.
| NRCan zone | Annual heating degree days below 18°C |
|---|---|
| Zone 4 | Under 3,000 |
| Zone 5 | 3,000 – 3,999 |
| Zone 6 | 4,000 – 4,999 |
| Zone 7a | 5,000 – 5,999 |
| Zone 7b | 6,000 – 6,999 |
| Zone 8 | Over 7,000 |
Alberta is a big province with a wide range of degree-day totals across it, from the milder river valleys in the south to the colder stretches farther north. That means the province does not sit neatly in a single zone the way the Calgary figure might suggest. A municipality with fewer heating degree days than Calgary could land in zone 5; one with more could sit in zone 7. This page can’t tell an individual reader which zone covers their own address, and it shouldn’t try to. What it can do is point to where that number lives: Environment and Climate Change Canada’s climate normals list heating degree days by station, and a municipality’s own building department can confirm which zone applies locally before insulation gets bought. Source: Natural Resources Canada, “Keeping the Heat In,” Section 2.
The insulation levels that apply here
Natural Resources Canada’s Table 2-1 sets recommended minimum insulation values by zone, and for zone 6, the numbers are these: walls at RSI 4.8 (R 27), basement walls at RSI 4.2 (R 24), roof or ceiling at RSI 10.6 (R 60), and floor over unheated space at RSI 7.1 (R 40). These are nominal insulating values, given in RSI first and the more familiar R-value second, since Canada’s own guidance labels the material in RSI.
What these numbers actually cover
Notice there are four figures, not three, and they cover four different building components, not one attic measured three ways. Ceiling insulation, basement wall insulation, above-grade wall insulation, and floor-over-unheated-space insulation each get their own line, and mixing them up is an easy way to under-buy one part of the house while over-buying another.
These are minimums, not a code requirement. Alberta’s actual building code, applied provincially and enforced municipally, can and sometimes does ask for more than NRCan’s baseline recommendation, particularly in newer construction standards. Treat the Table 2-1 numbers as a floor to check against, not a ceiling to stop at.
Why the zone still matters here
These four figures are specific to zone 6, the Calgary station’s zone. A reader elsewhere in Alberta, in a colder zone 7 municipality, would be working from a different row of NRCan’s table entirely, with higher minimums across all four components. There’s no single Alberta number to average toward. A homeowner in a colder part of the province who insulates to the zone 6 minimum is under-insulating for their own climate, even though the zone 6 figures are correct for Calgary’s reference station.
| Building component | RSI | R-value |
|---|---|---|
| Roof or ceiling | 10.6 | R 60 |
| Floor over unheated space | 7.1 | R 40 |
| Walls | 4.8 | R 27 |
| Basement walls | 4.2 | R 24 |
Sealing comes before insulating
U.S. ENERGY STAR treats air sealing and insulation as two steps of a single project, and its own project guidance puts attic air sealing before attic insulation, not the other way around. The reasoning holds regardless of which side of the border a house sits on: insulation slows heat moving through a material, but it does nothing to stop air moving around it. A layer of new insulation spread over an unsealed gap, a wiring penetration, or an old bathroom fan housing just hides the leak. It doesn’t close it.
That’s why the order of work matters more than the R-value alone. ENERGY STAR lays out a sequence, and it’s worth following roughly in order:
- Seal air leaks in the attic first, before any insulation goes down.
- Add or top up attic insulation once the sealing is done.
- Address the rim joist area, a common and often-overlooked air leak point.
- Seal and insulate the floor over unheated spaces, such as a crawlspace.
- Move to walls only after the attic, rim joist, and floor work is complete.
The published savings estimates cover sealing and insulating together, as one combined project, not sealing on its own. There’s no separate percentage attached to sealing alone, and treating the two steps as interchangeable misses the point of doing them in order. For the mechanics of each step, from finding leaks to choosing insulation depth, the national insulation guides on this site walk through the work in more detail than a province-level page can. Source: U.S. ENERGY STAR.
What the winter here actually asks for
Heating degree days measure demand, not temperature. The Calgary Int’l A station’s roughly 4,979 heating degree days a year below 18°C describes how much heating a typical building in that climate needs to do over the course of a year, added up day by day. Twice the degree days means roughly twice the fuel burned to hold the same indoor temperature, everything else being equal. It’s a workload number, not a weather forecast.
Statistics Canada’s most recent heating system survey shows what Alberta homes are actually running to meet that demand. Forced-air furnaces are the primary heating system in 78% of homes, and boilers paired with hot-water or steam radiators account for another 7%. Heat pumps, electric baseboard heaters, and heating stoves are all listed as not reported in that survey, meaning the estimate was suppressed as statistically unreliable, not that nobody in the province uses them.
Why the furnace share changes the priority list
A province heated mostly by forced-air furnaces running through ductwork carries a different set of insulation priorities than one running mostly on boilers and radiators. Ductwork that runs through an unconditioned attic is its own heat-loss point, one that ceiling insulation alone doesn’t fix. Sealed and insulated ductwork, or ductwork relocated into conditioned space, can matter as much as the R-value overhead. With 78% of Alberta homes on forced-air systems, that’s not a marginal detail for most of the province’s housing stock.
- Confirm the local zone and degree-day figure for the specific municipality before setting an insulation target.
- Seal and insulate attic ductwork if the home runs a forced-air furnace, since that describes most Alberta homes.
- Work through the sealing-then-insulating order in the attic, rim joist, and floor before touching walls.
- Check basement wall insulation separately from above-grade wall insulation; NRCan’s table treats them as different components with different minimums.
The duct-sealing and ductwork guides on this site cover the specifics of that forced-air work in more depth than fits here.
What the work is worth
U.S. ENERGY STAR’s own modelling puts a number on the combined project: “EPA estimates that homeowners can save an average of 15% on heating and cooling costs (or an average of 11% on total energy costs) by air sealing their homes and adding insulation in attics, floors over crawl spaces, and accessible basement rim joists.” Both figures matter together, since 15% and 11% are percentages of two different totals, heating-and-cooling costs versus total energy costs, and quoting one without the other misrepresents the estimate.
These numbers come from energy modelling of a typical existing U.S. home, run as an average across a broad housing stock. They’re not a promise for any one house in Alberta, and the model doesn’t cover every part of a building envelope. The estimate names three specific locations: attics, floors over crawl spaces, and accessible basement rim joists. It says nothing about walls, windows, or doors, and stretching the figure to cover those isn’t supported by the source.
Worth keeping separate too: ENERGY STAR’s own program landing page cites “up to a 10% savings on your annual energy bills” for similar work, a different figure built on a different baseline, and the U.S. Department of Energy’s often-cited 10% figure refers to a thermostat setback of 7 to 10 degrees Fahrenheit held for eight hours a day, which has nothing to do with insulation at all. Three real numbers, three different claims, and only the first, the 15%-and-11% pair tied to attics, crawlspace floors, and rim joists, describes what sealing and insulating an existing home actually does. Source: U.S. ENERGY STAR methodology.